New article
Recently updated
Inserting chart images in the custom report document editor

Who is this article for?Users who want to insert chart images in the custom report document editor.
No elevated permissions are required.
Discover how to easily add images to your custom report in the document editor. This guide will effortlessly take you through selecting images and adjusting alignment and display settings.
1. Inserting chart images in the custom report document editor
1.1. Video
1.2. Steps
- Begin in the Document Editor of the Custom Report, where the chart is included.
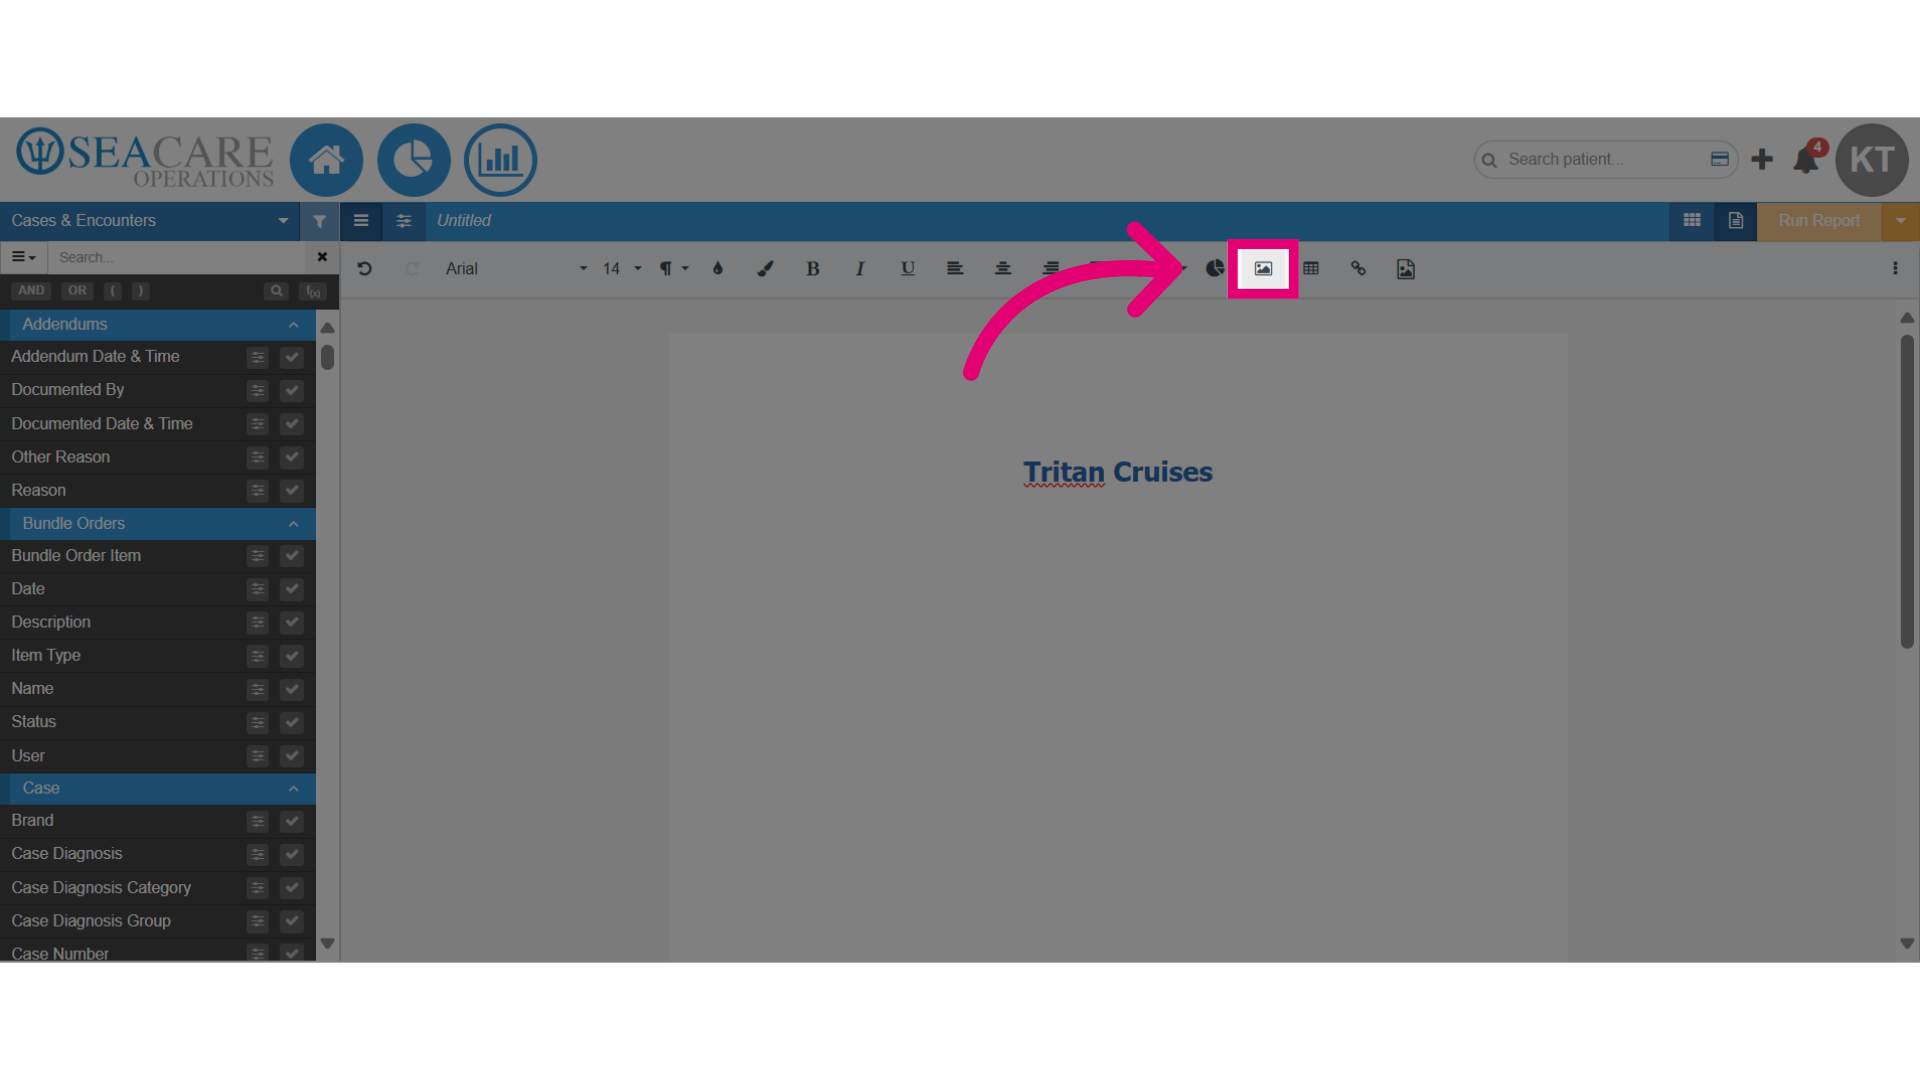
- Select the spot in the document editor to insert the image, then click the image button on the formatting toolbar.
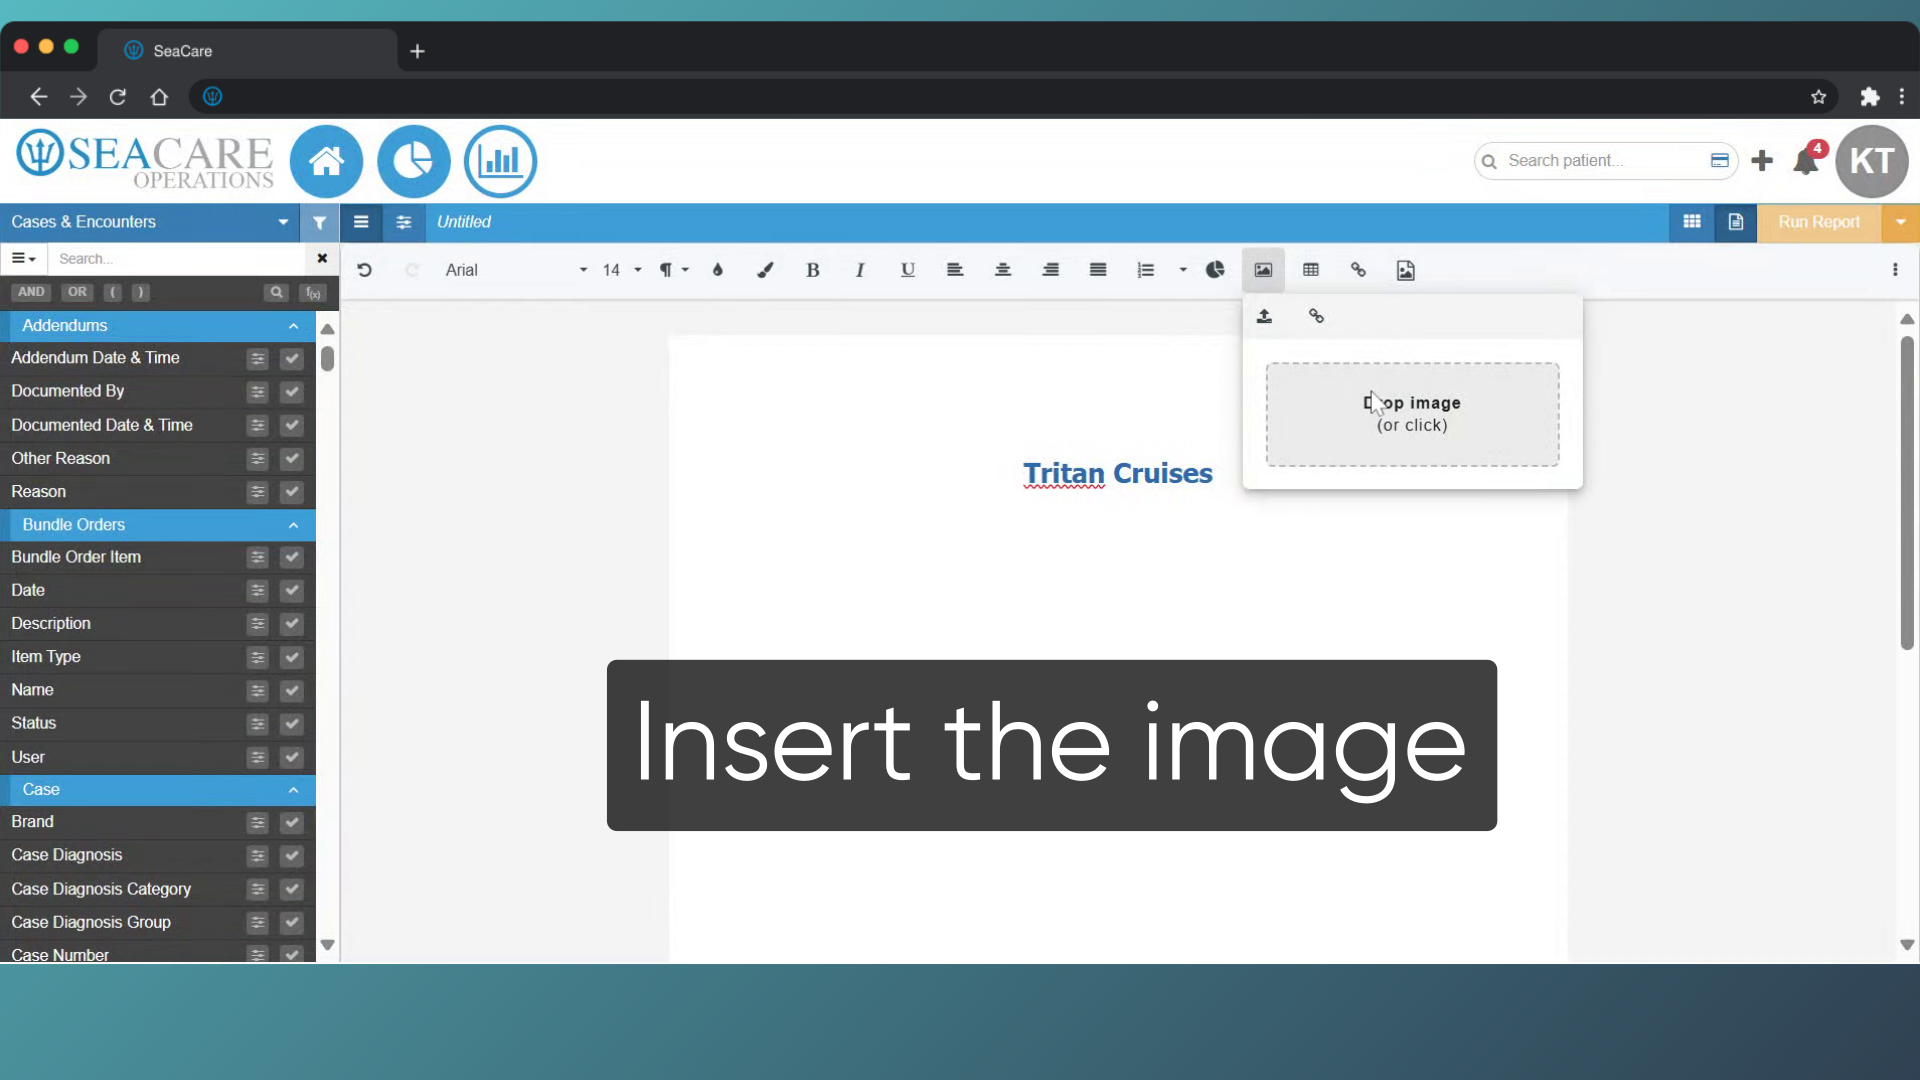
- Click to upload the image from your files on your device then insert the image on the document.
- Verify that the image is added onto the document.
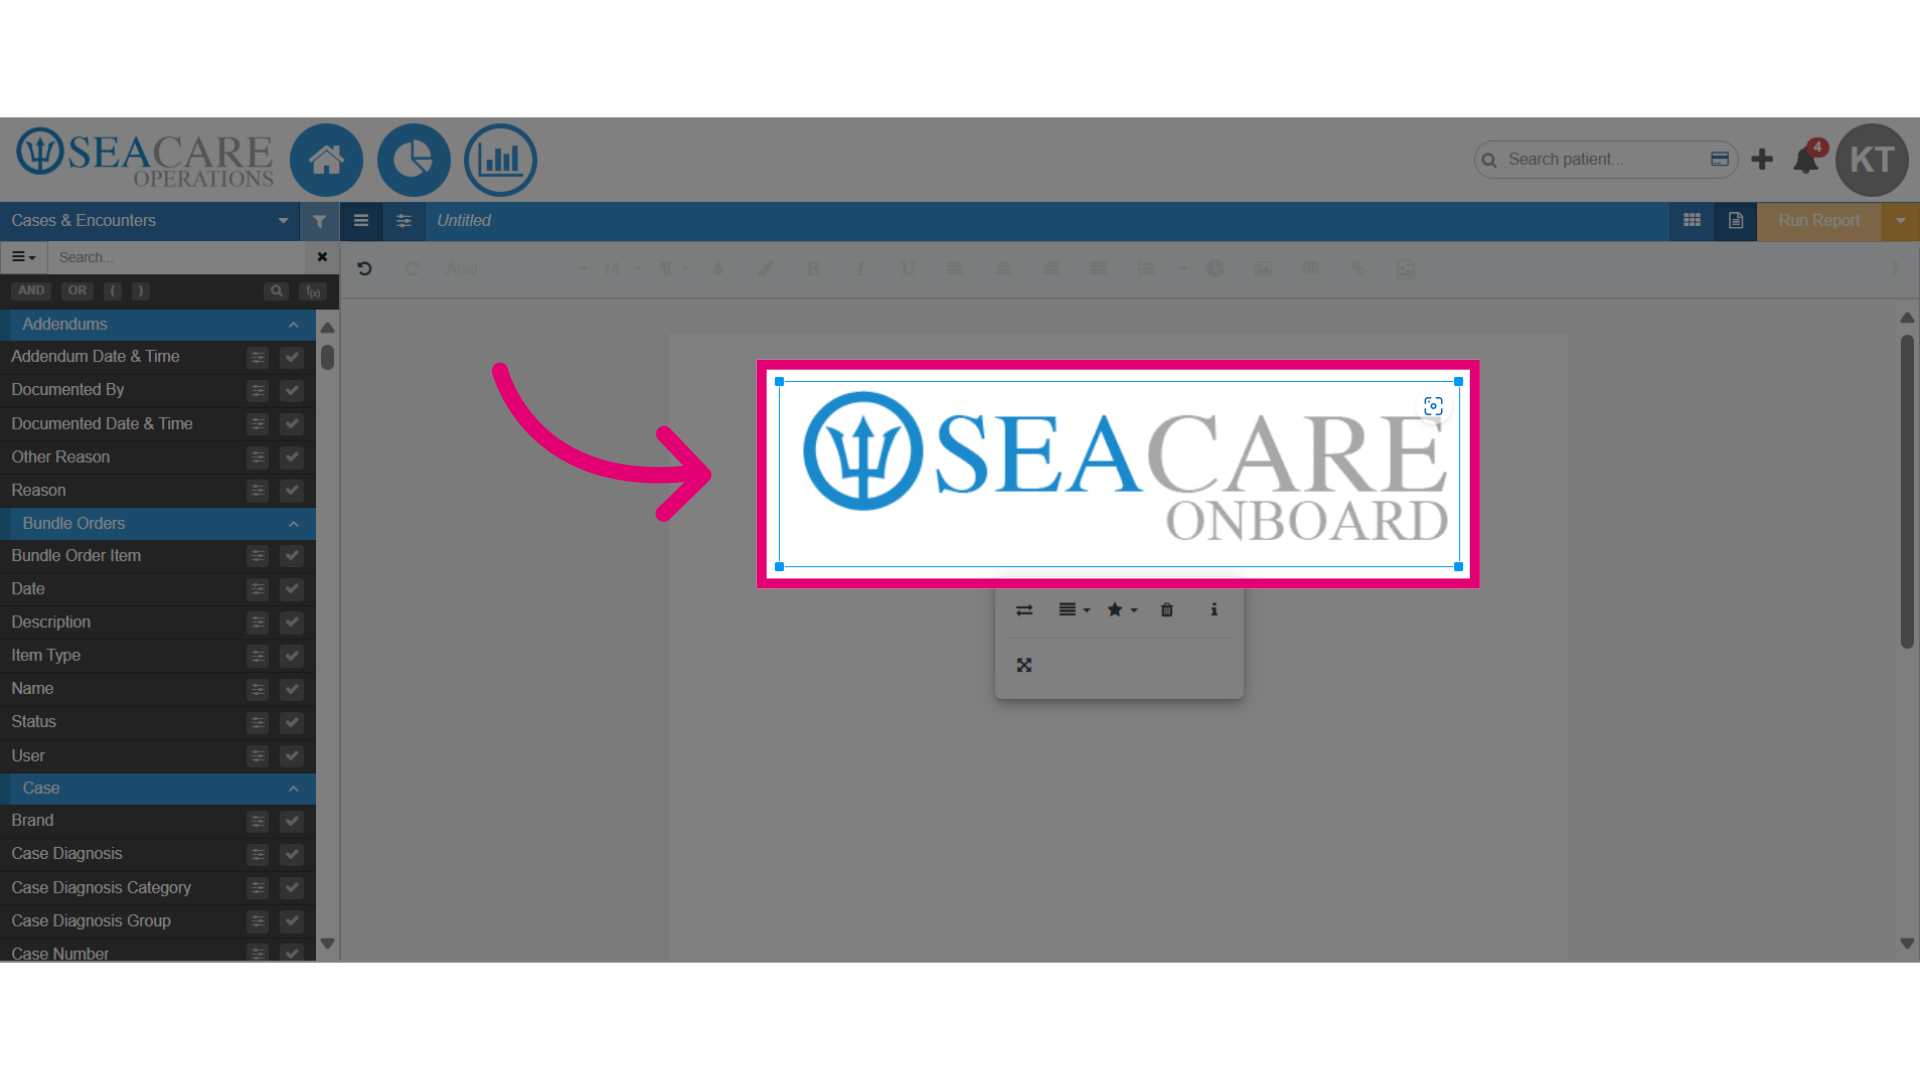
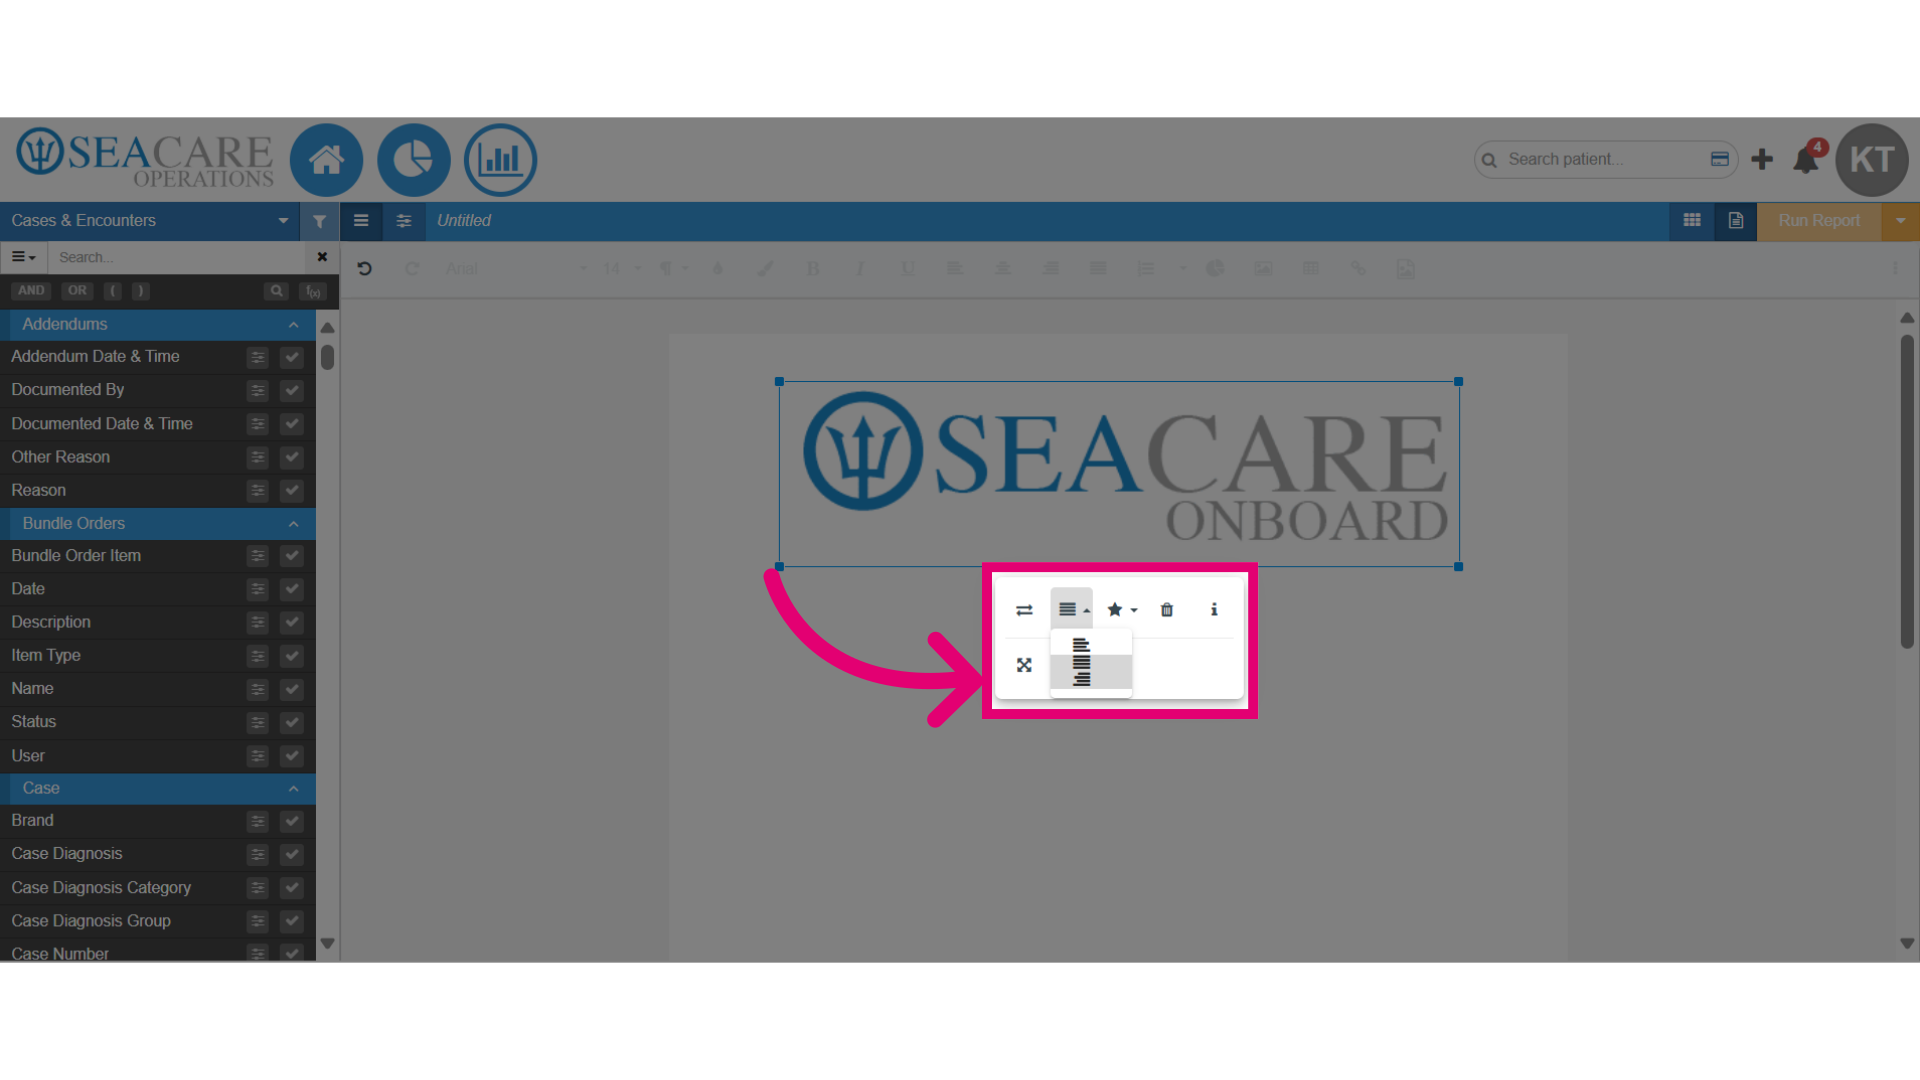
- Then, select the alignment option for the image to align the image on the document where you wish.
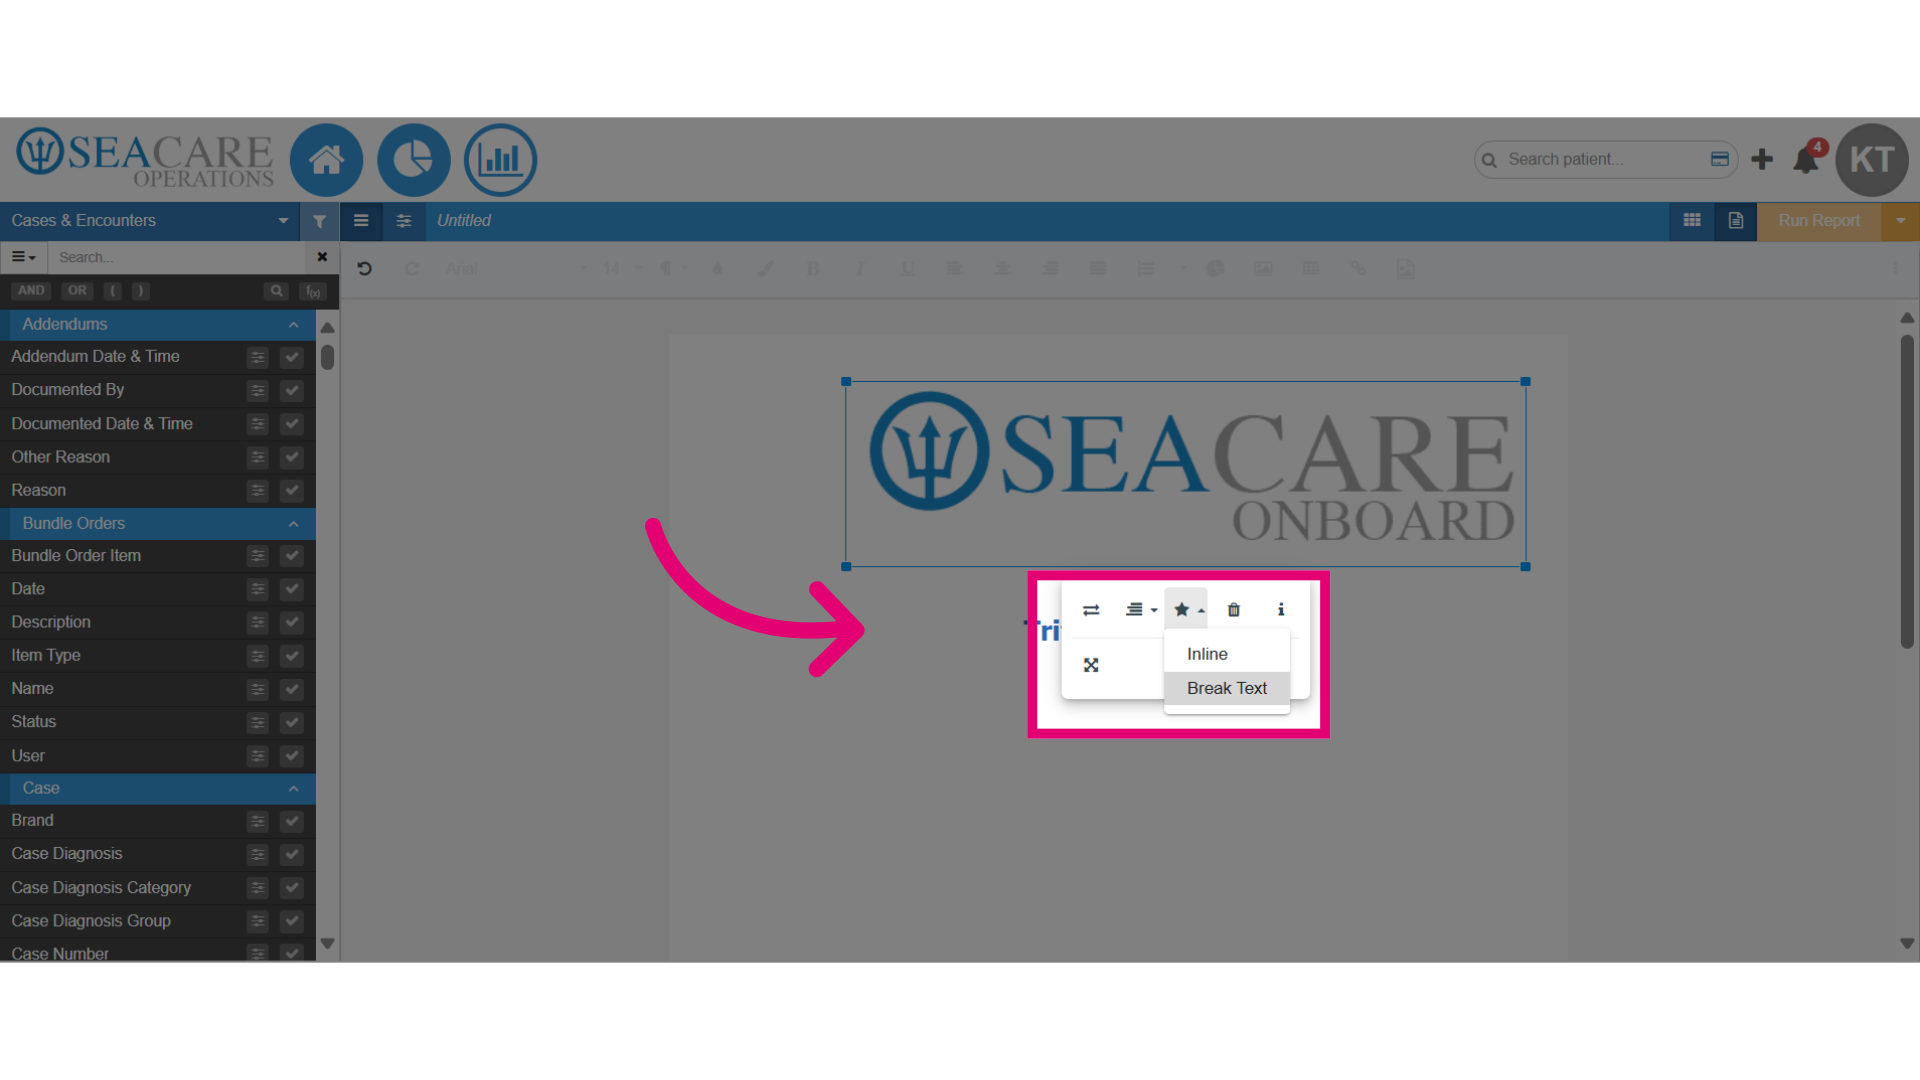
- Select Display, and choose how the image should be displayed in the document such as inline or break text.
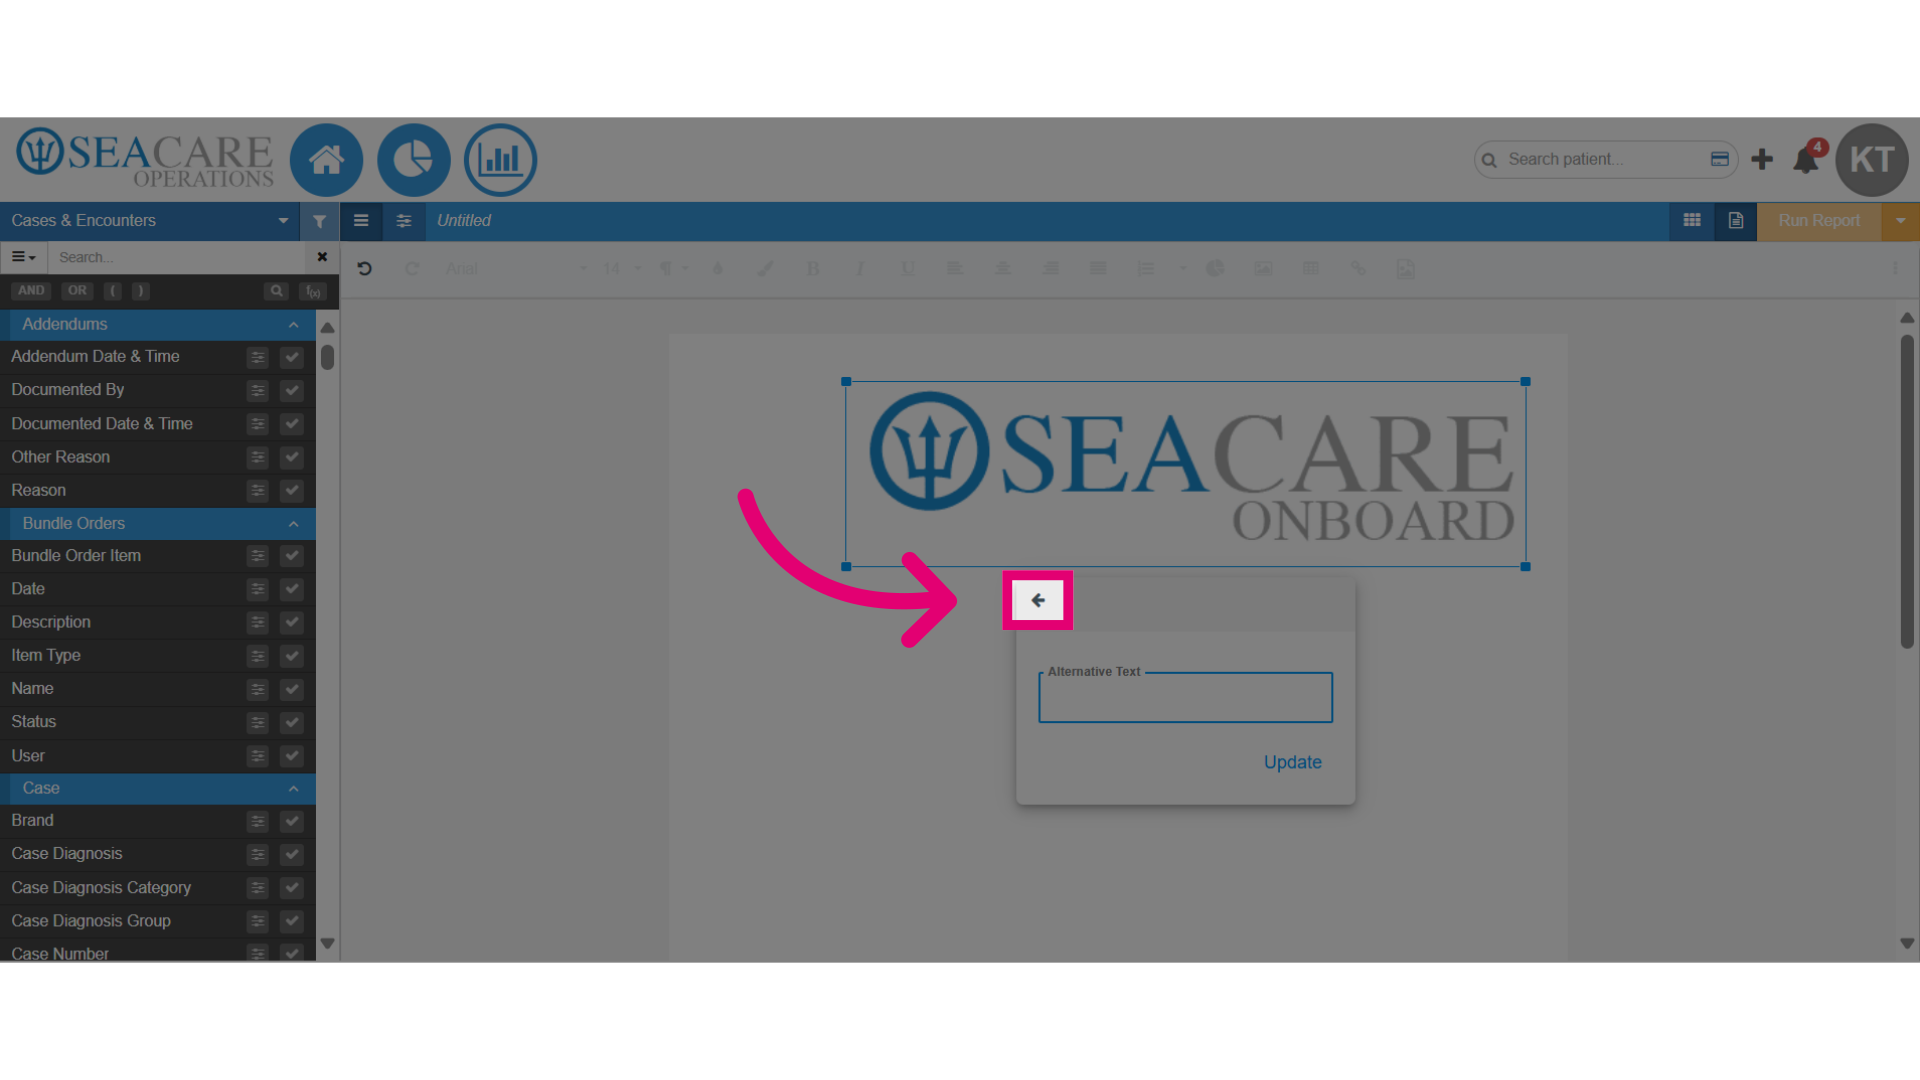
- Click on the image, and add alternative text for the image if desired.
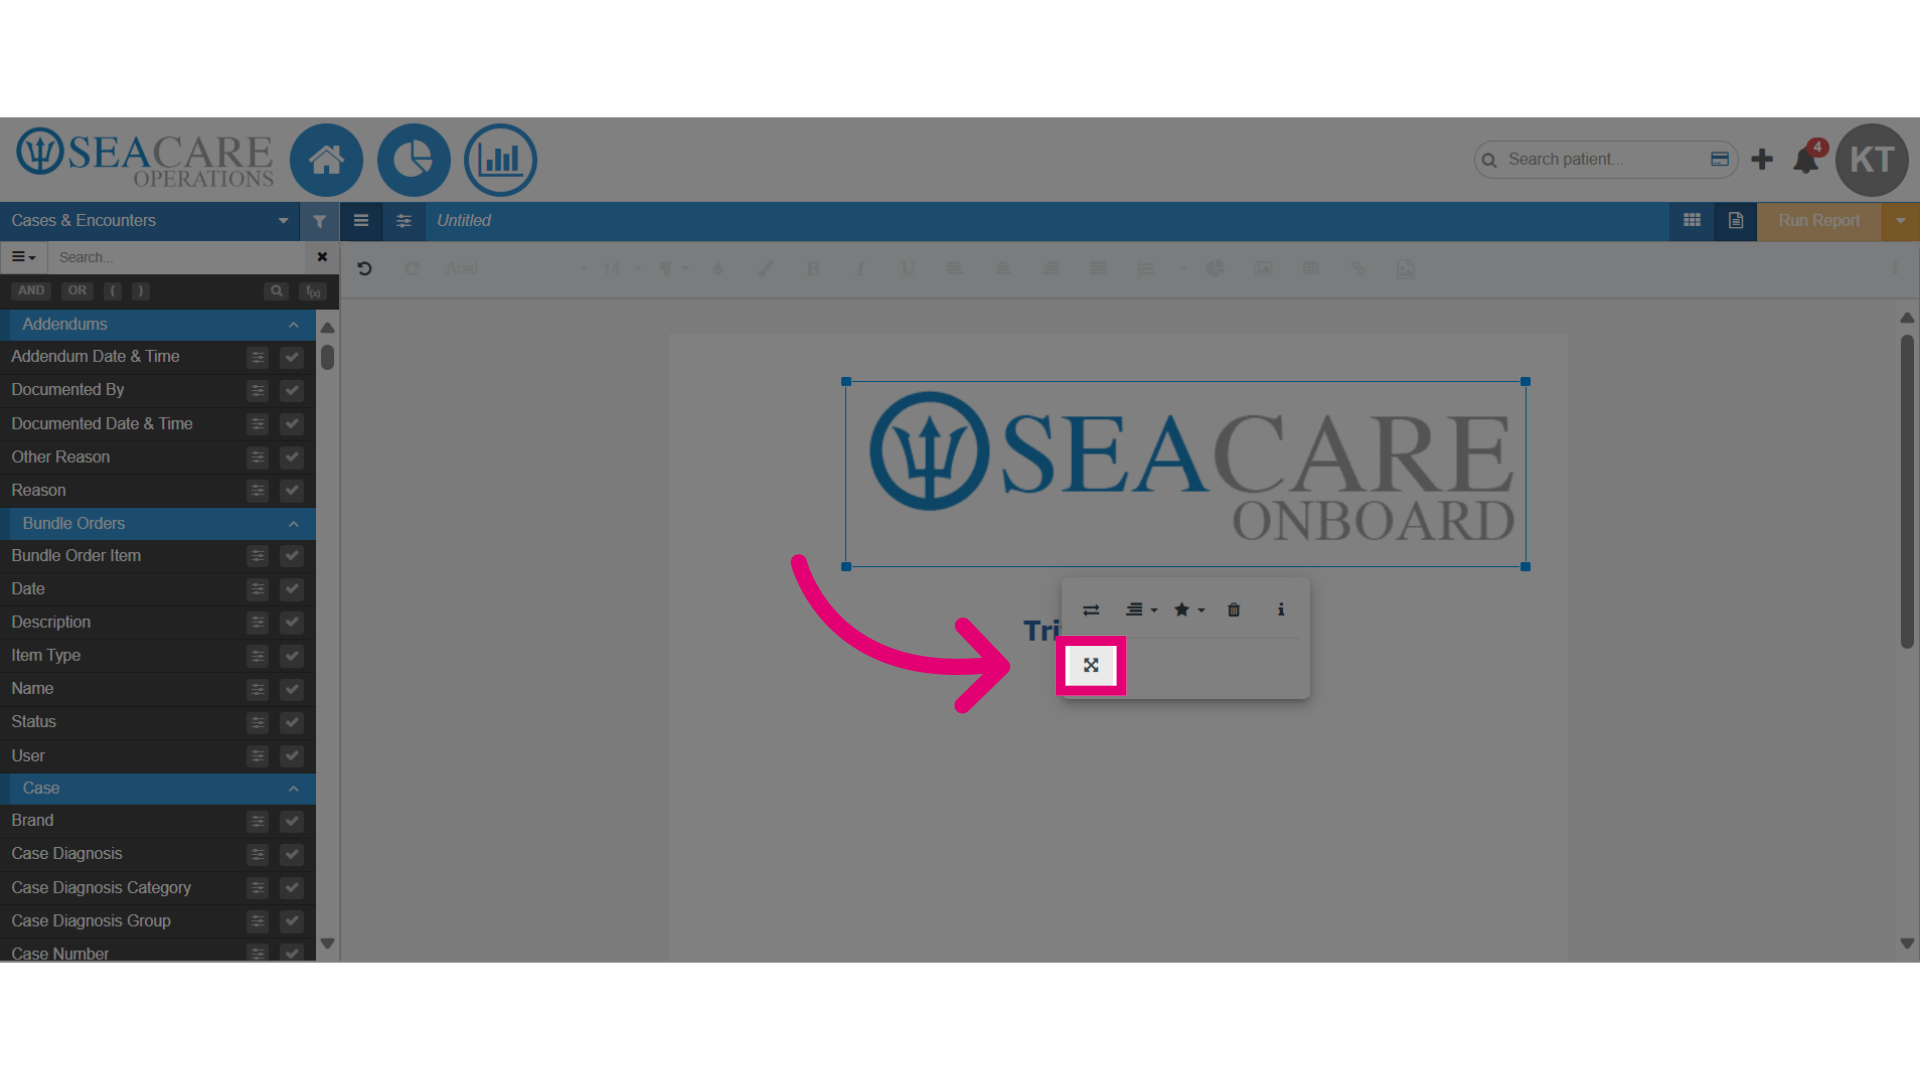
- Click the resize option to modify the dimensions and adjust the size of the image as required.
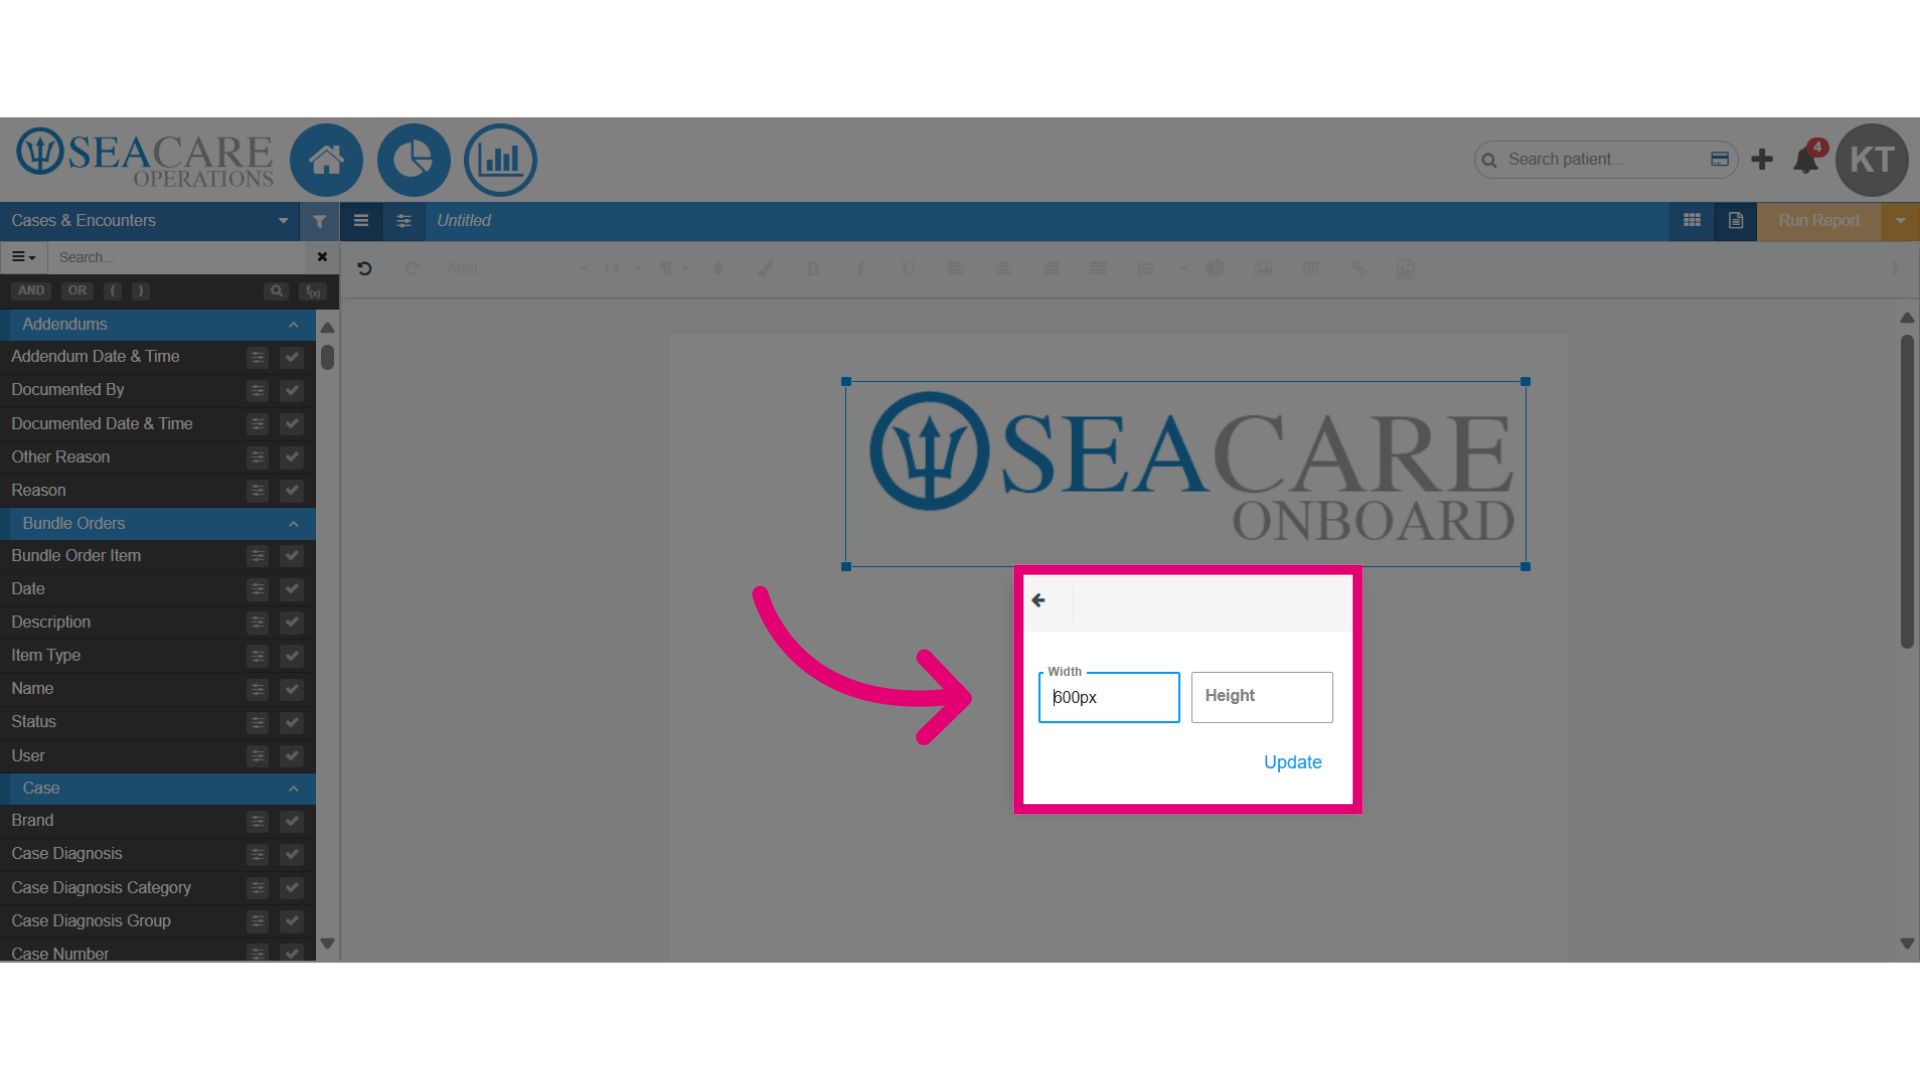
- Change the number for the width and height of the image to modify the size.
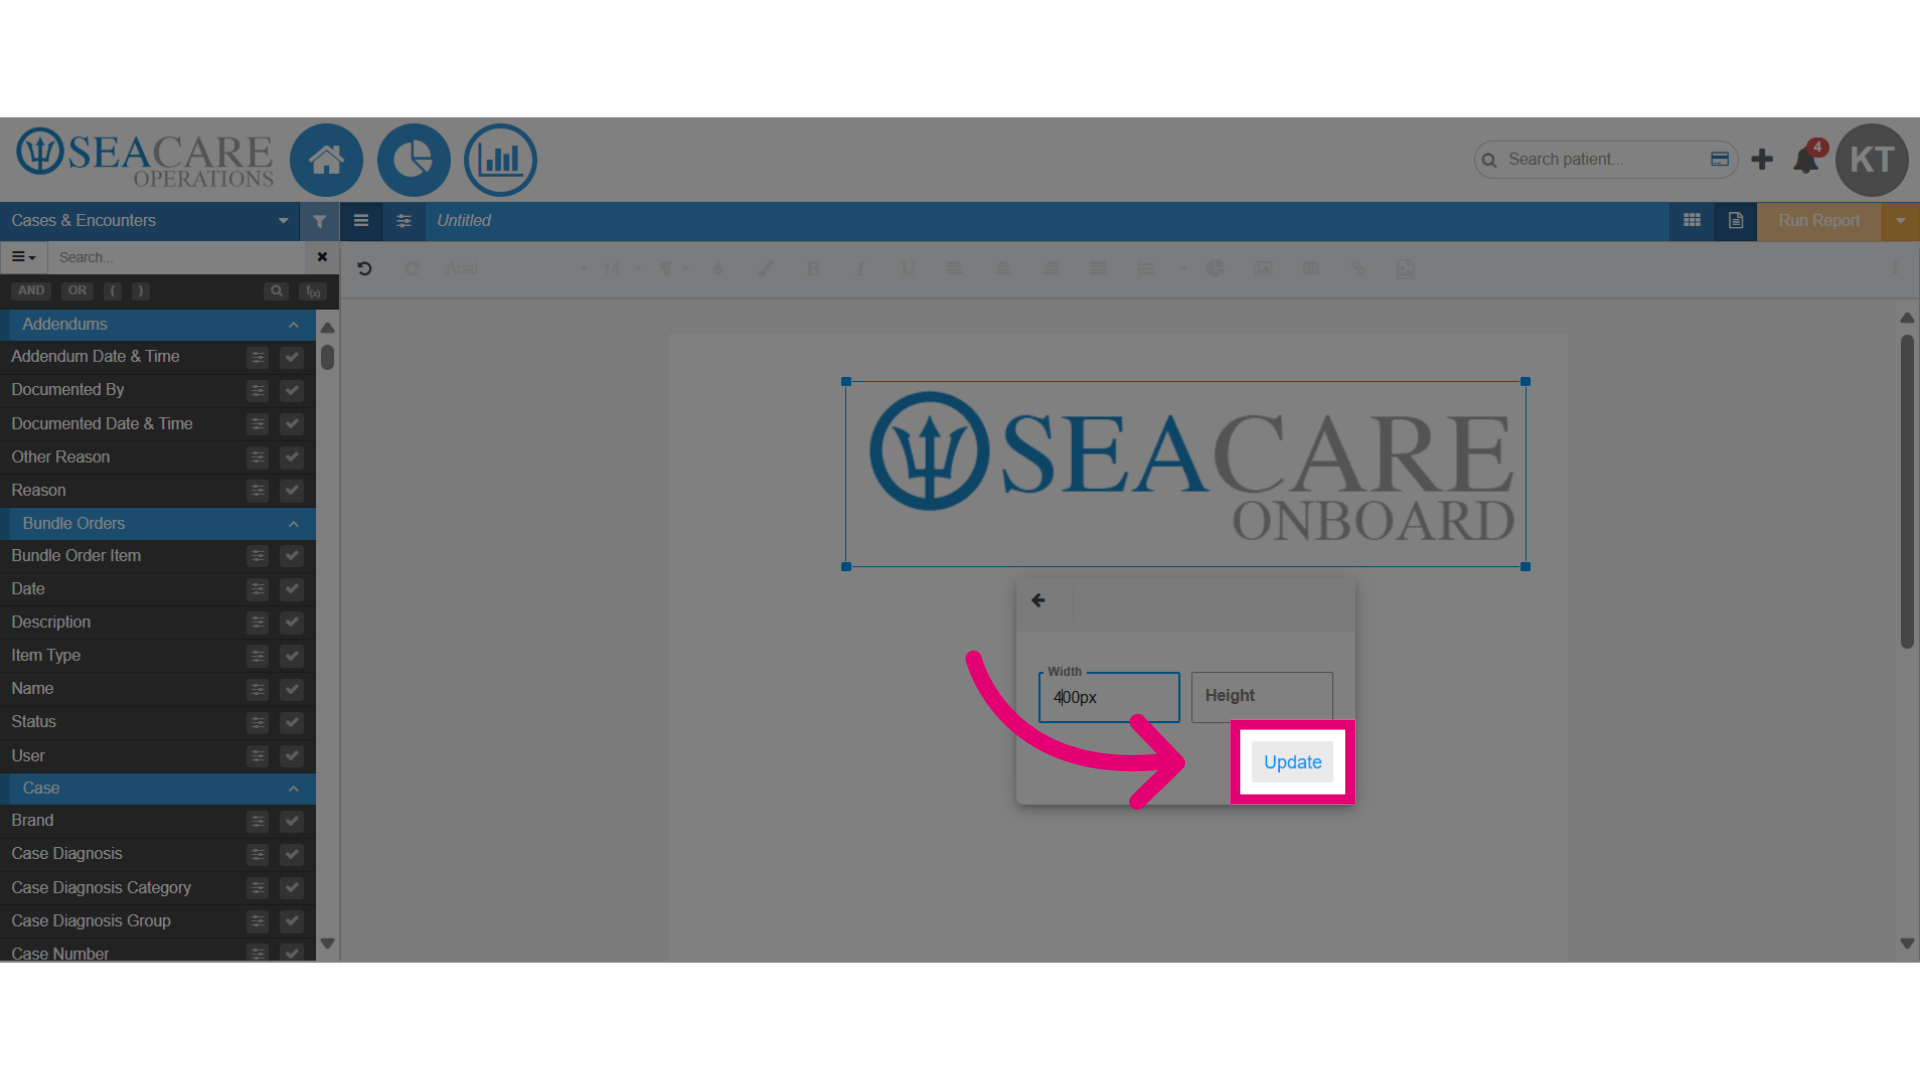
- Select Update to save the changes.
- View the updated image that reflects the changes that were made.