New article
Recently updated
Editing values in the custom report document editor

Who is this article for?Users who want to learn how to edit values in the custom report document editor.
No elevated permissions are required.
This guide explains how to edit and customise value settings in charts within the Custom Report Document Editor. Adjusting chart values is beneficial in custom report editing.
1. Editing values in the custom report document editor
1.1. Video
1.2. Steps
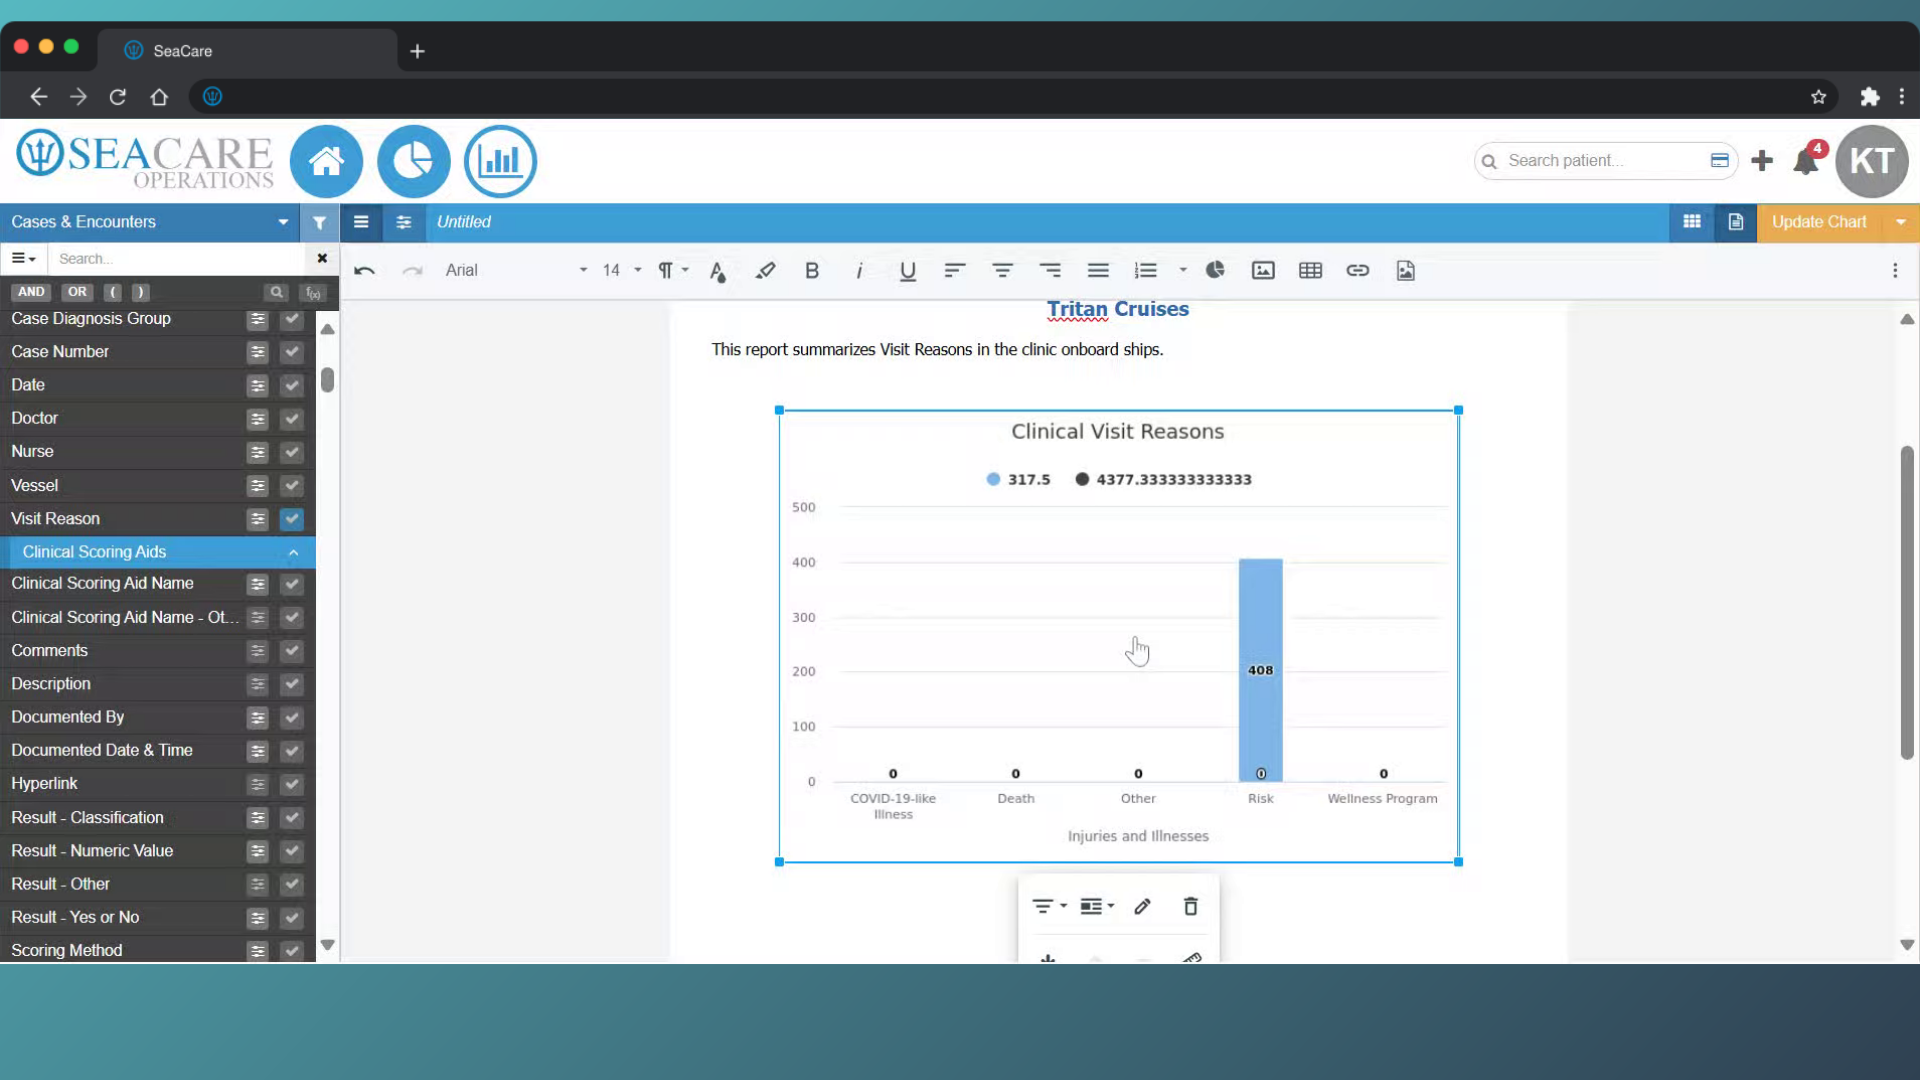
- Begin in the Document Editor of the Custom Report, with the chart included in the document.
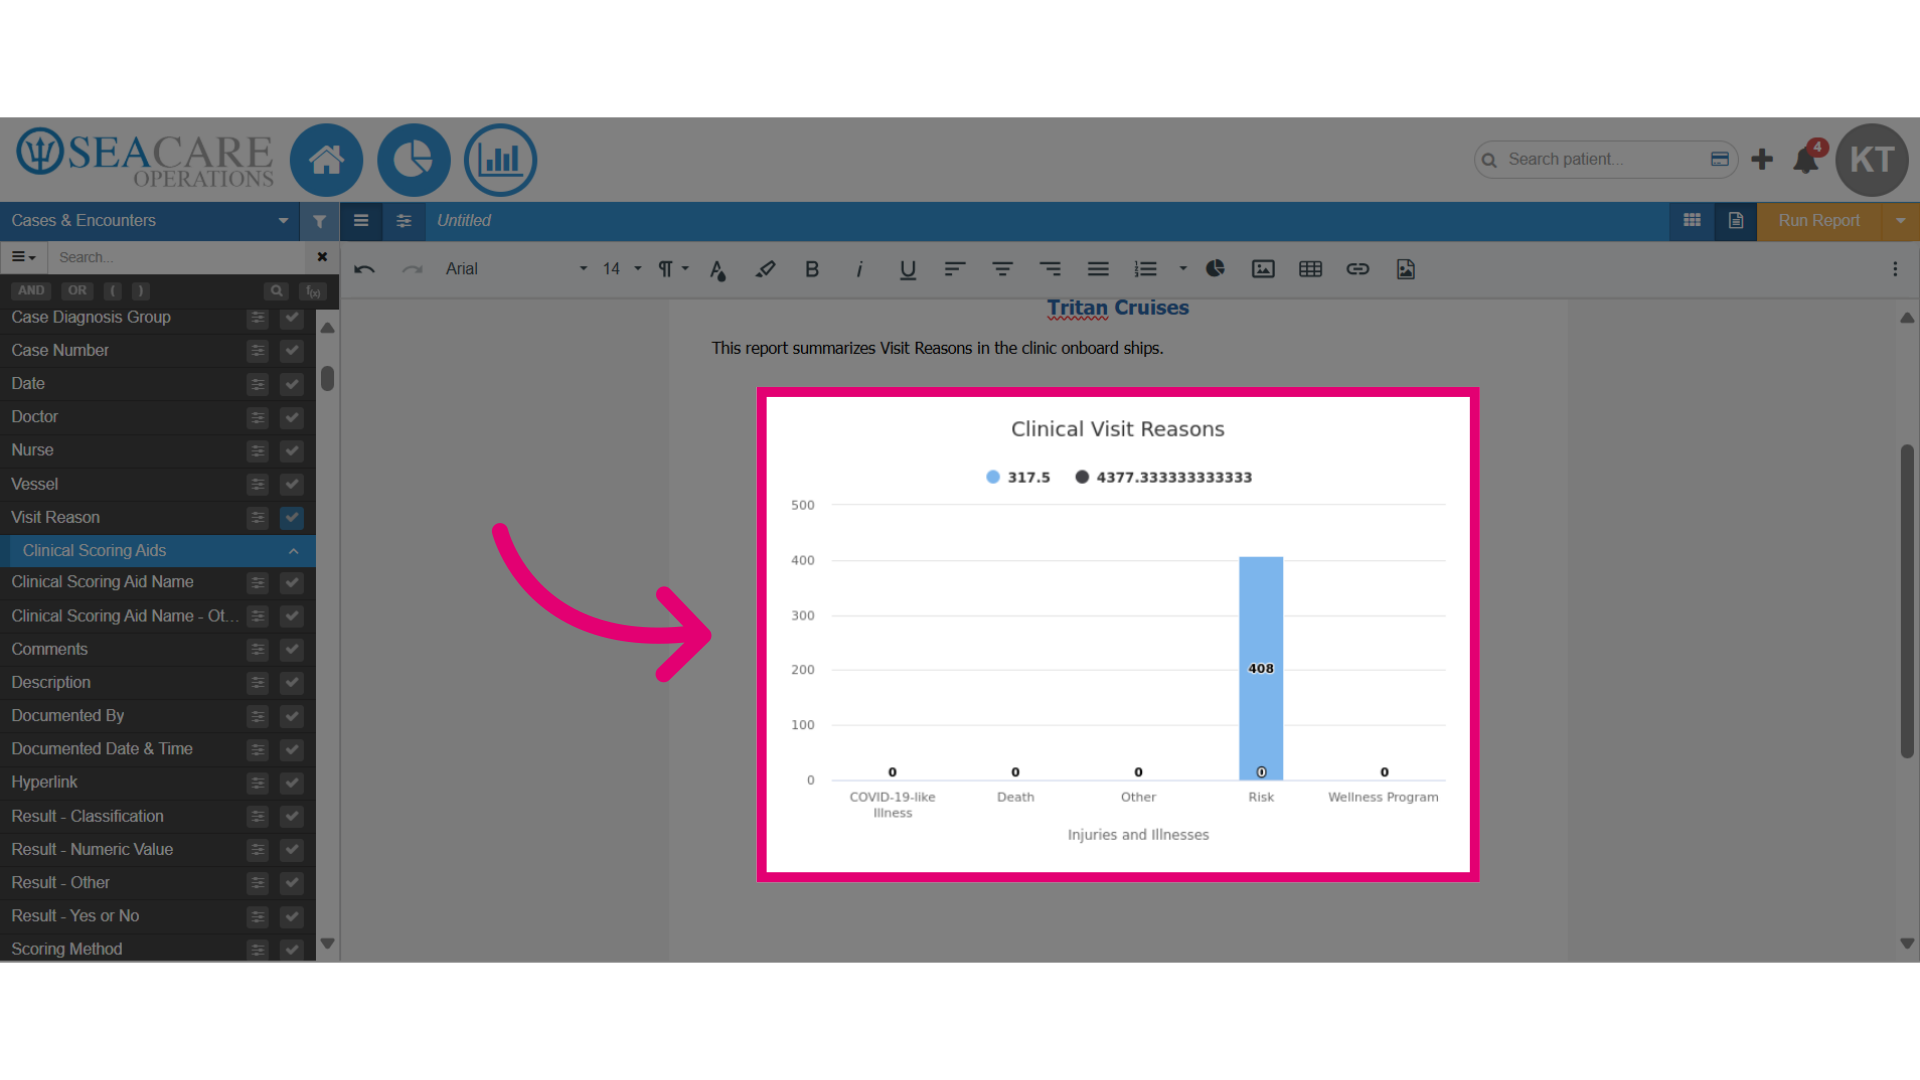
- Start by clicking on the chart to access the editing options.
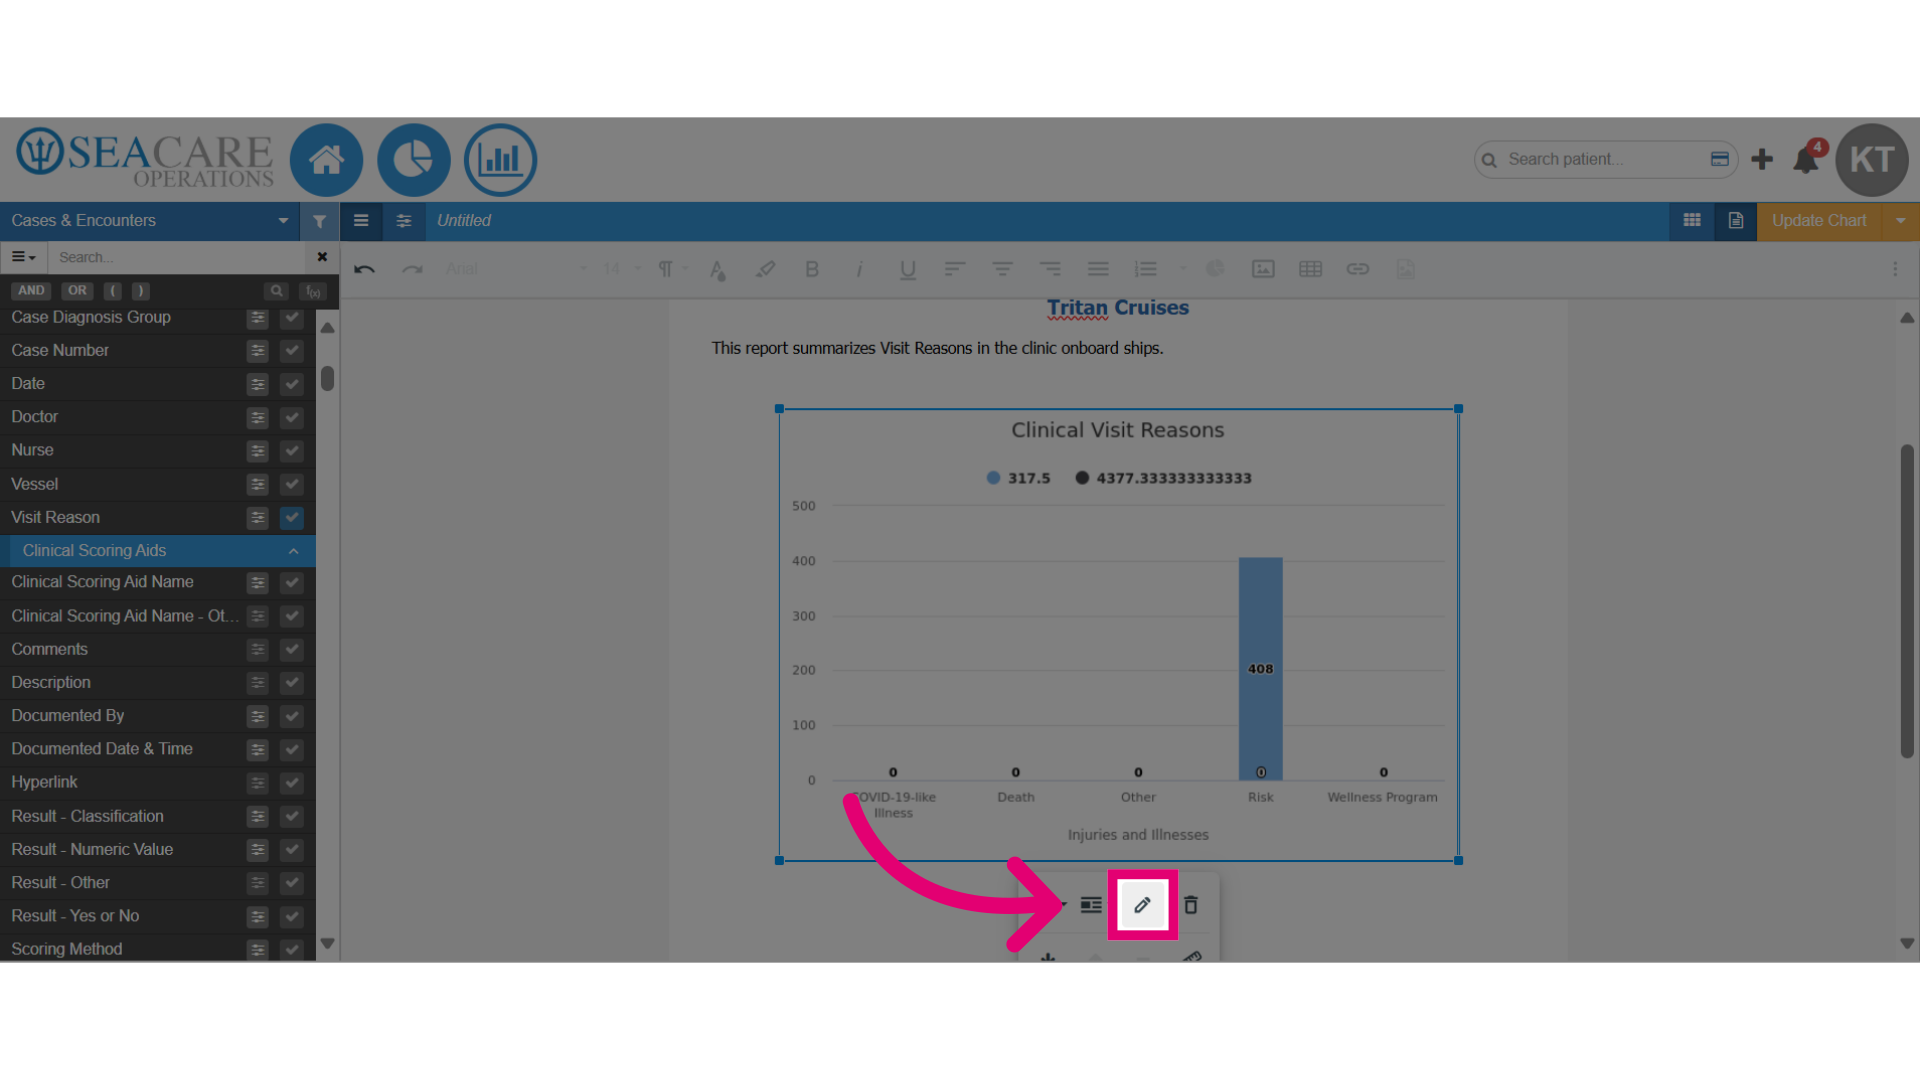
- Select the Edit pencil icon to open the edit settings.
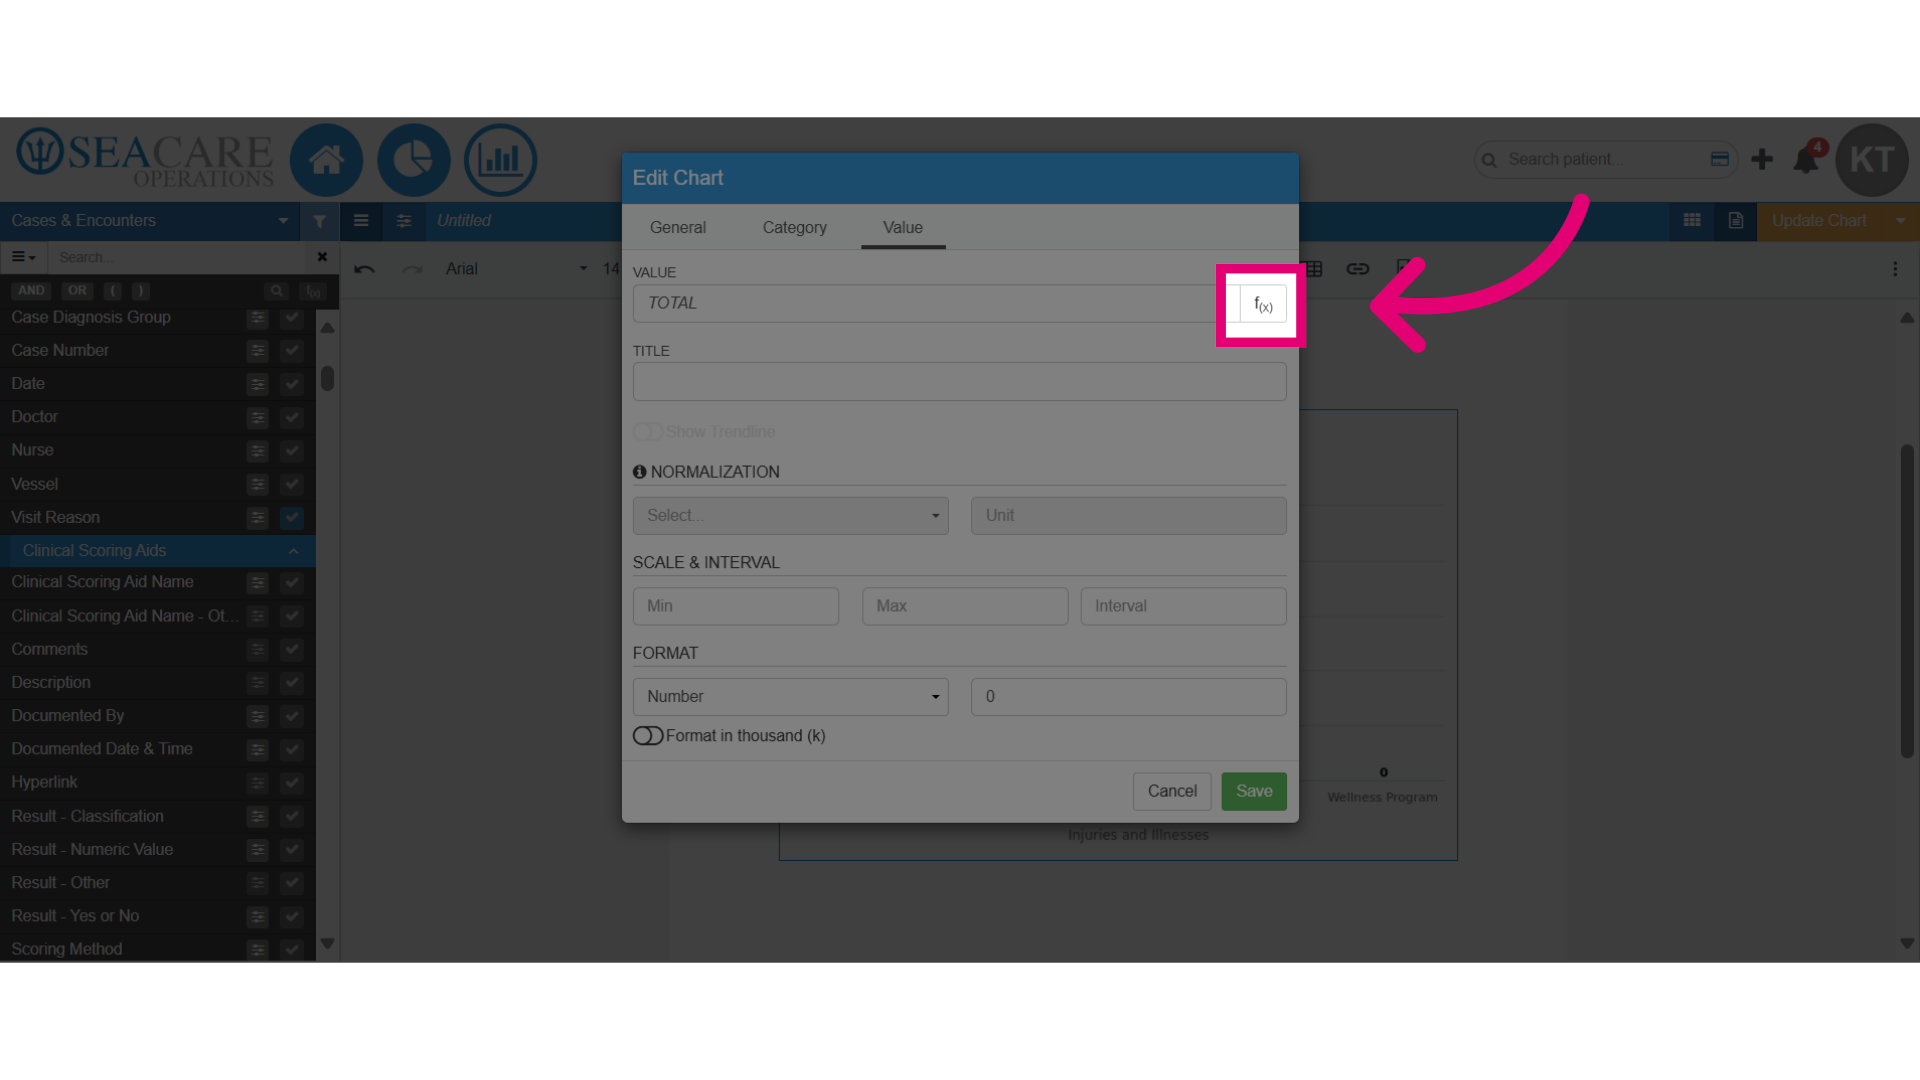
- Select the Value tab.
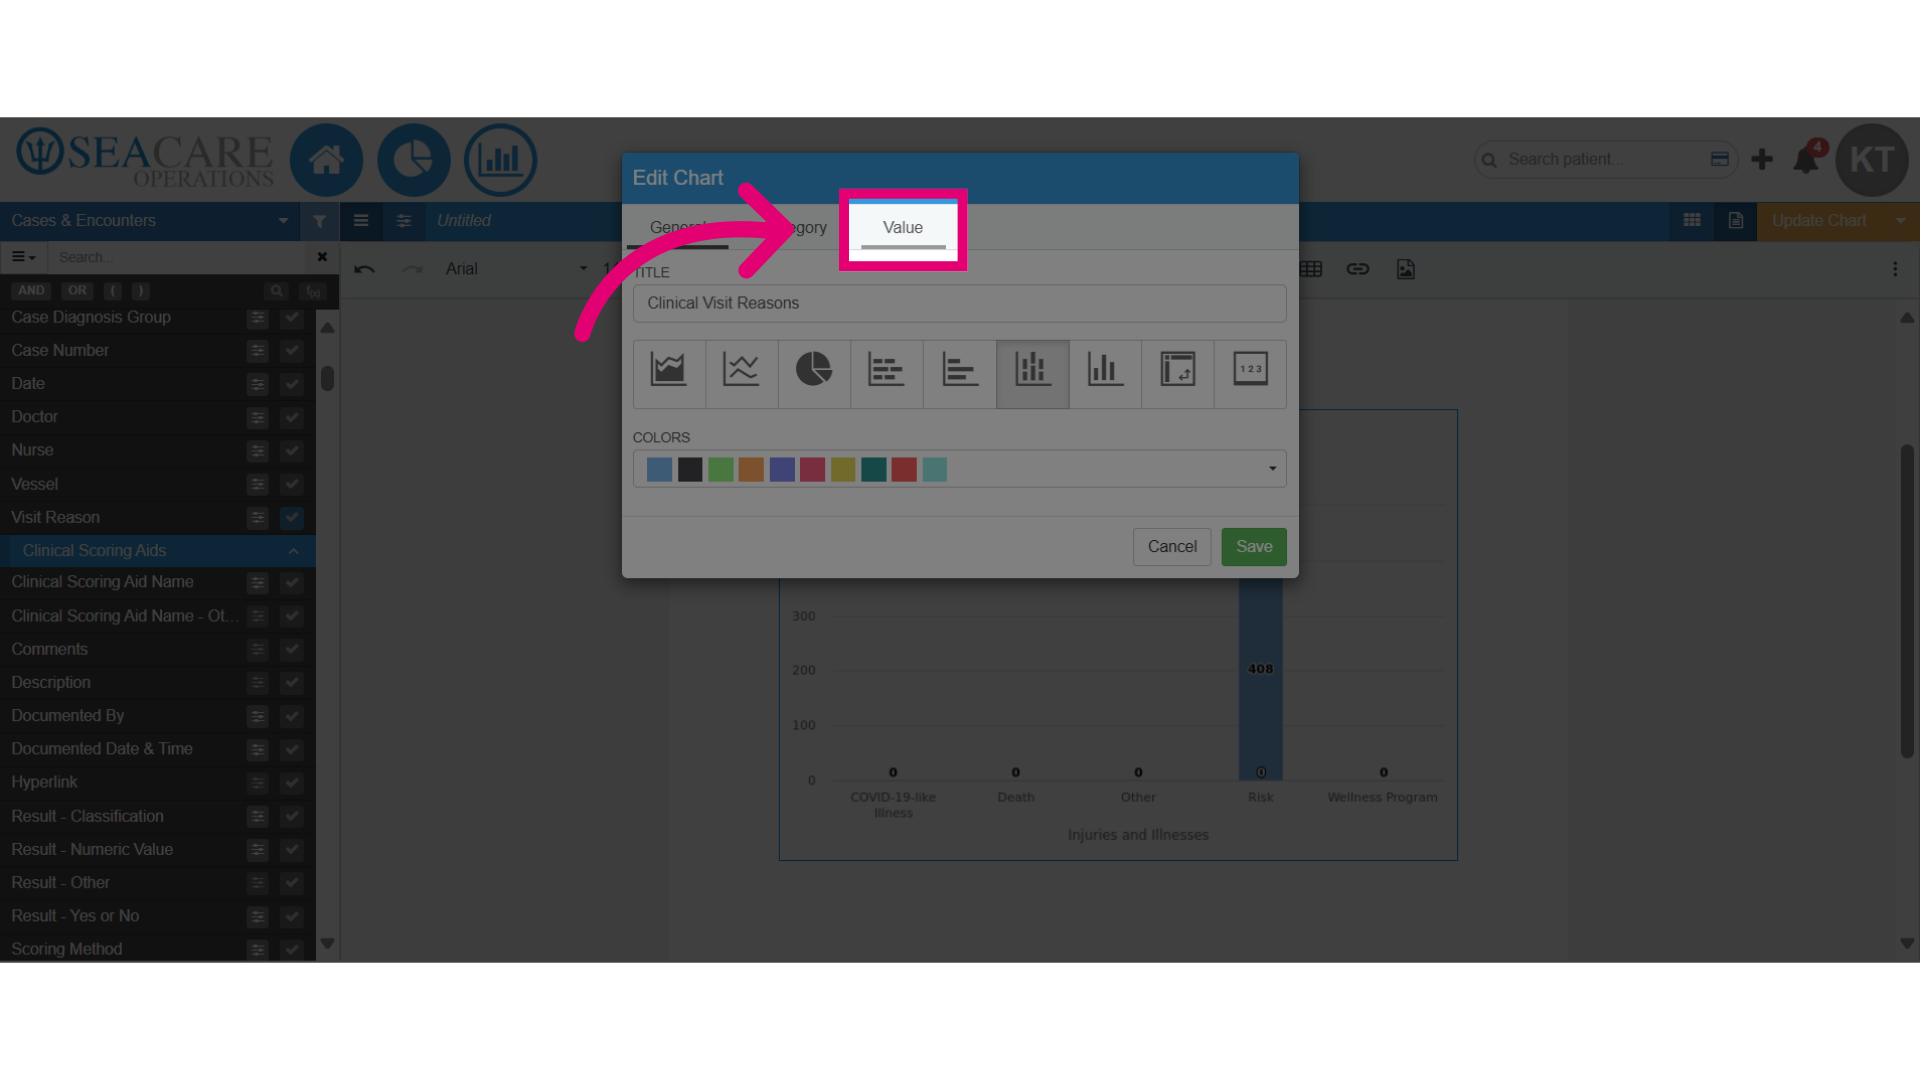
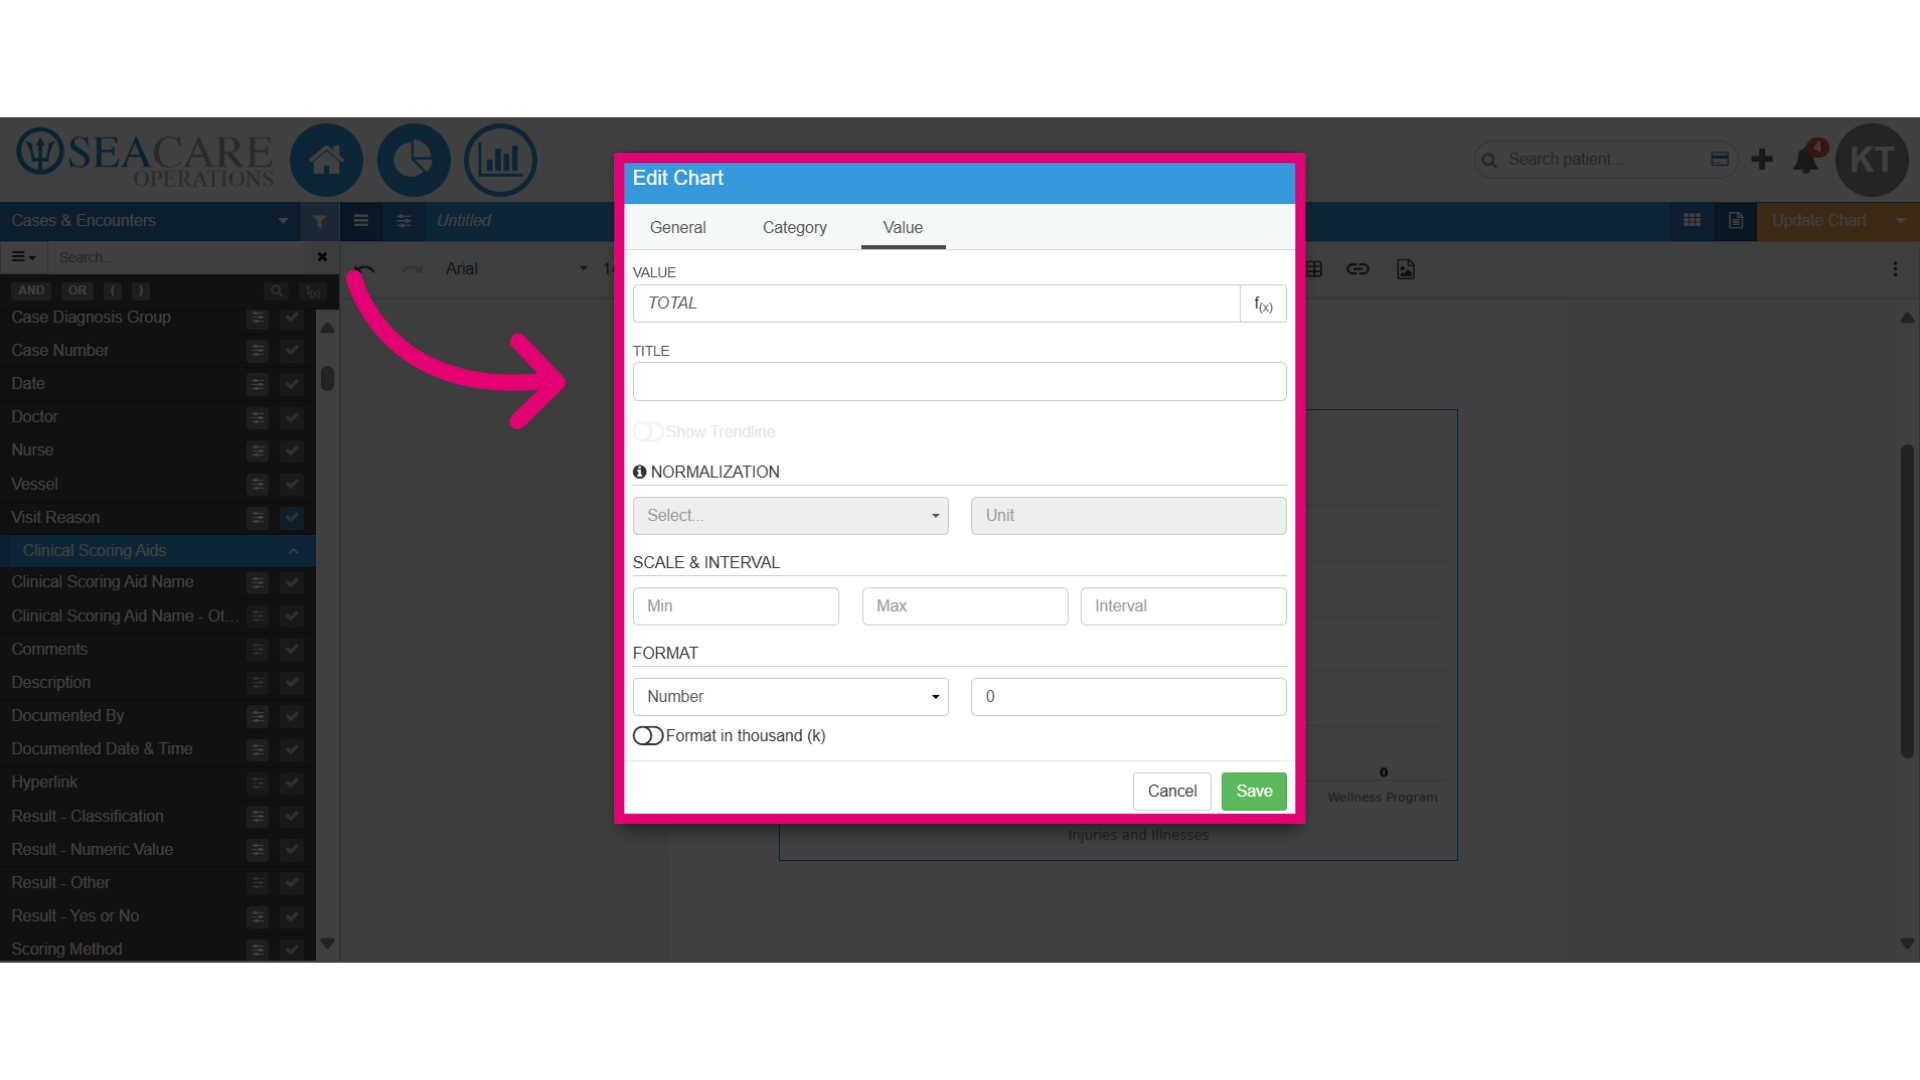
- Here you can modify the value, add titles, intervals and formatting.
- Edit the value by typing in a new value in the smart search.
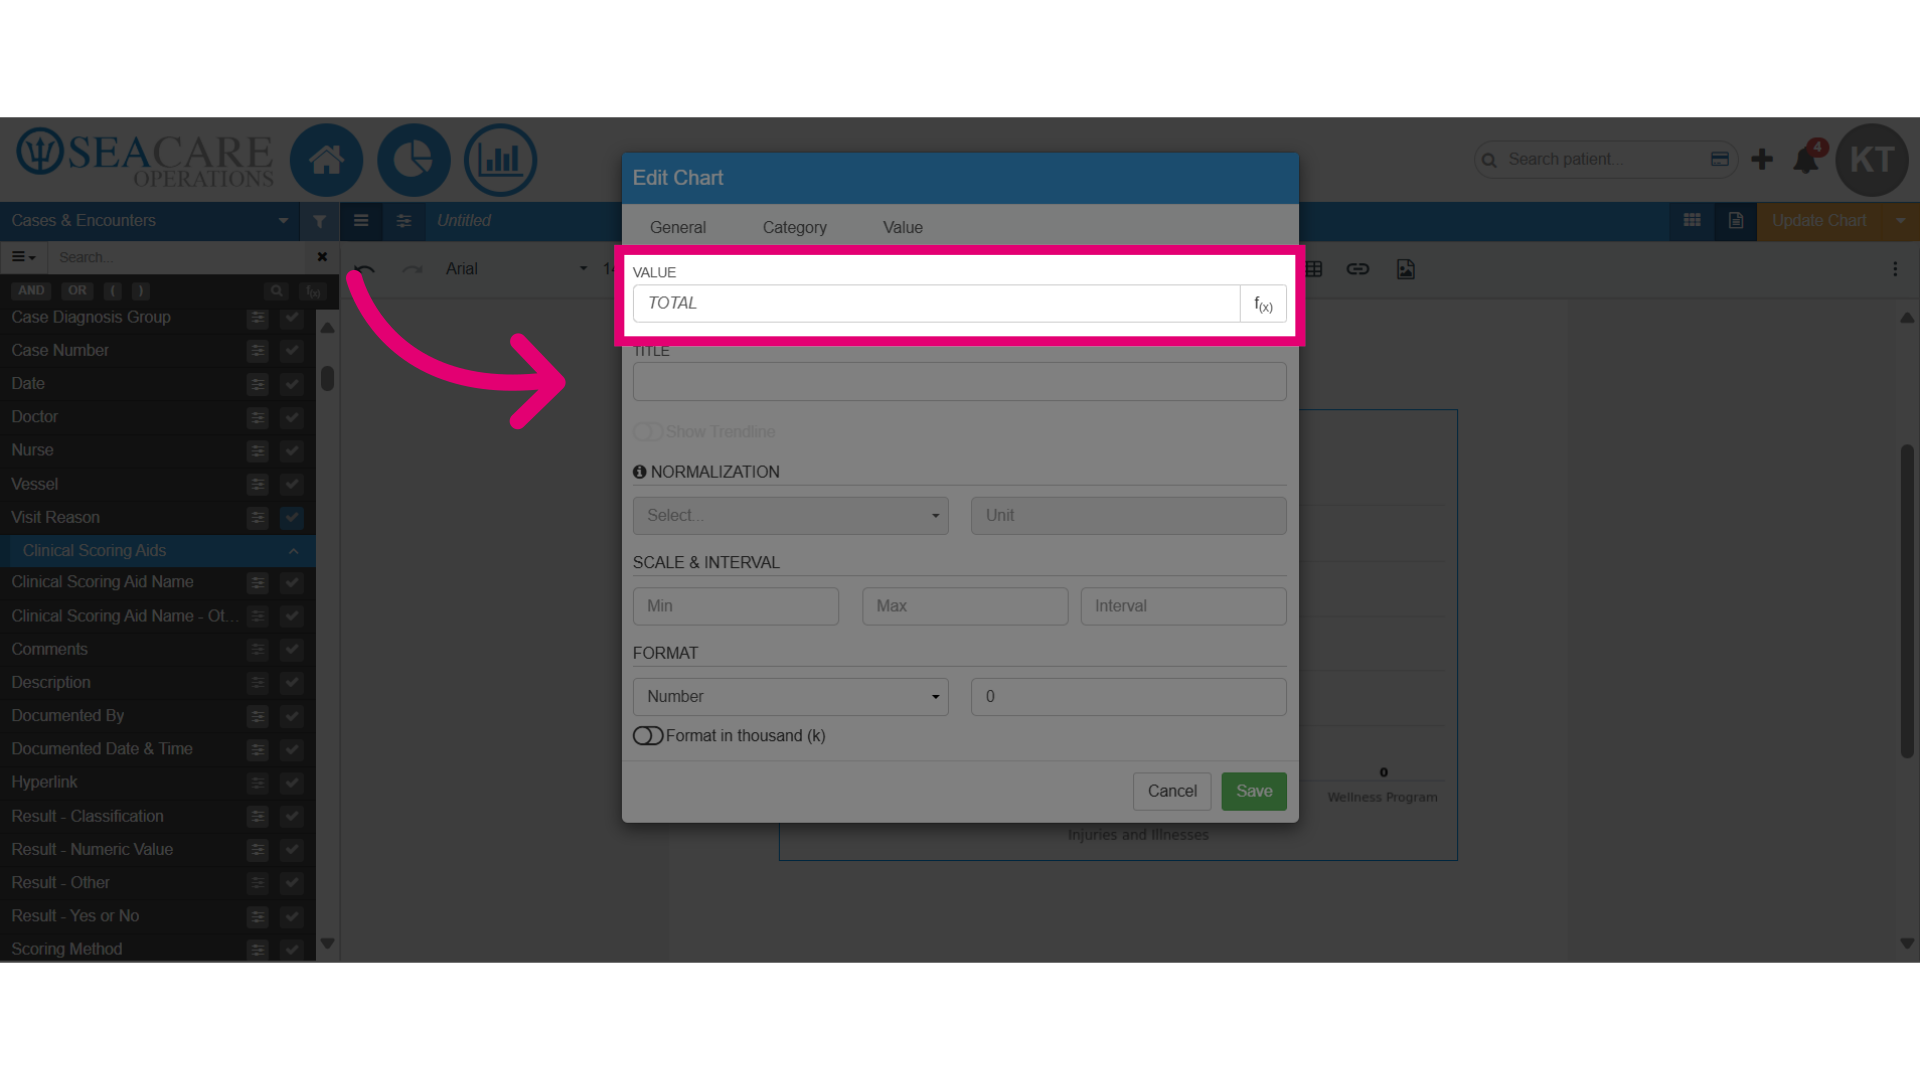
- Then select a value from the options that appear in the list matching your key words.
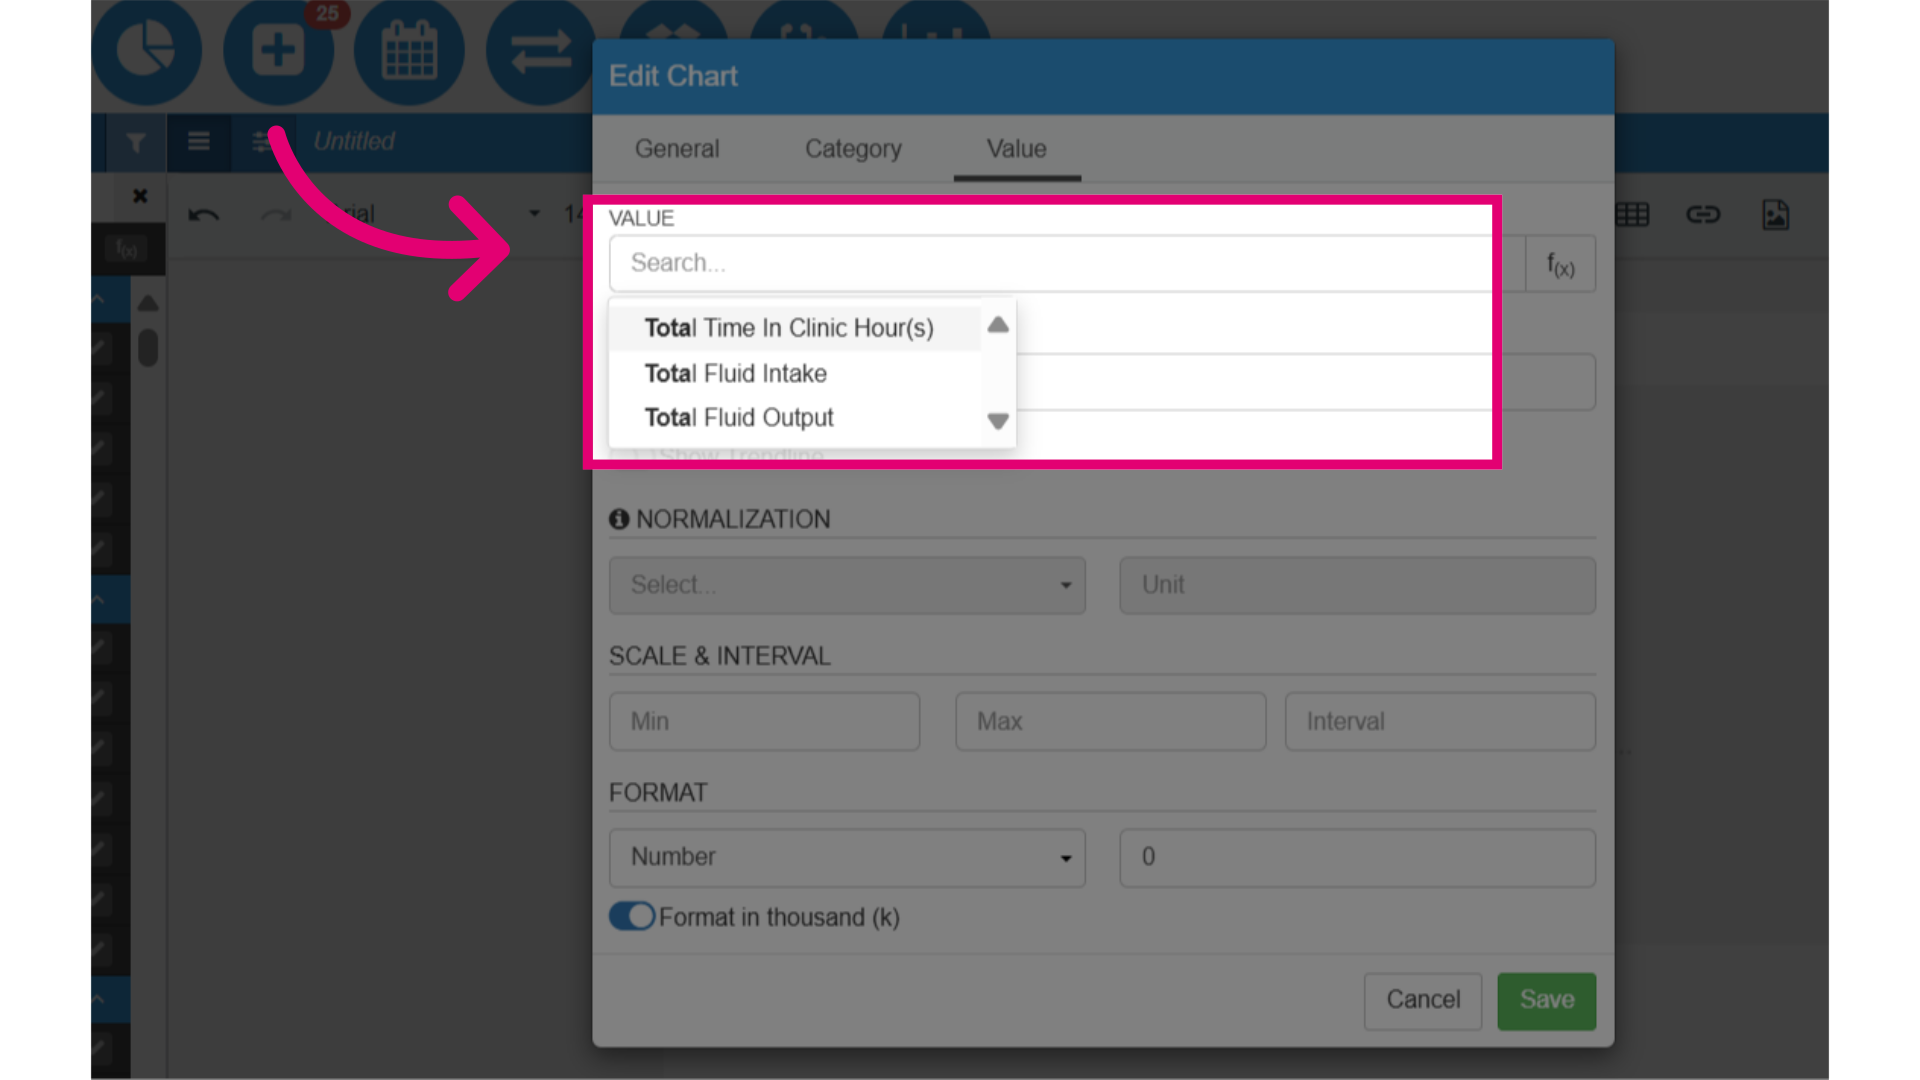
- Next, click on the f(x) button to add a function to the value.
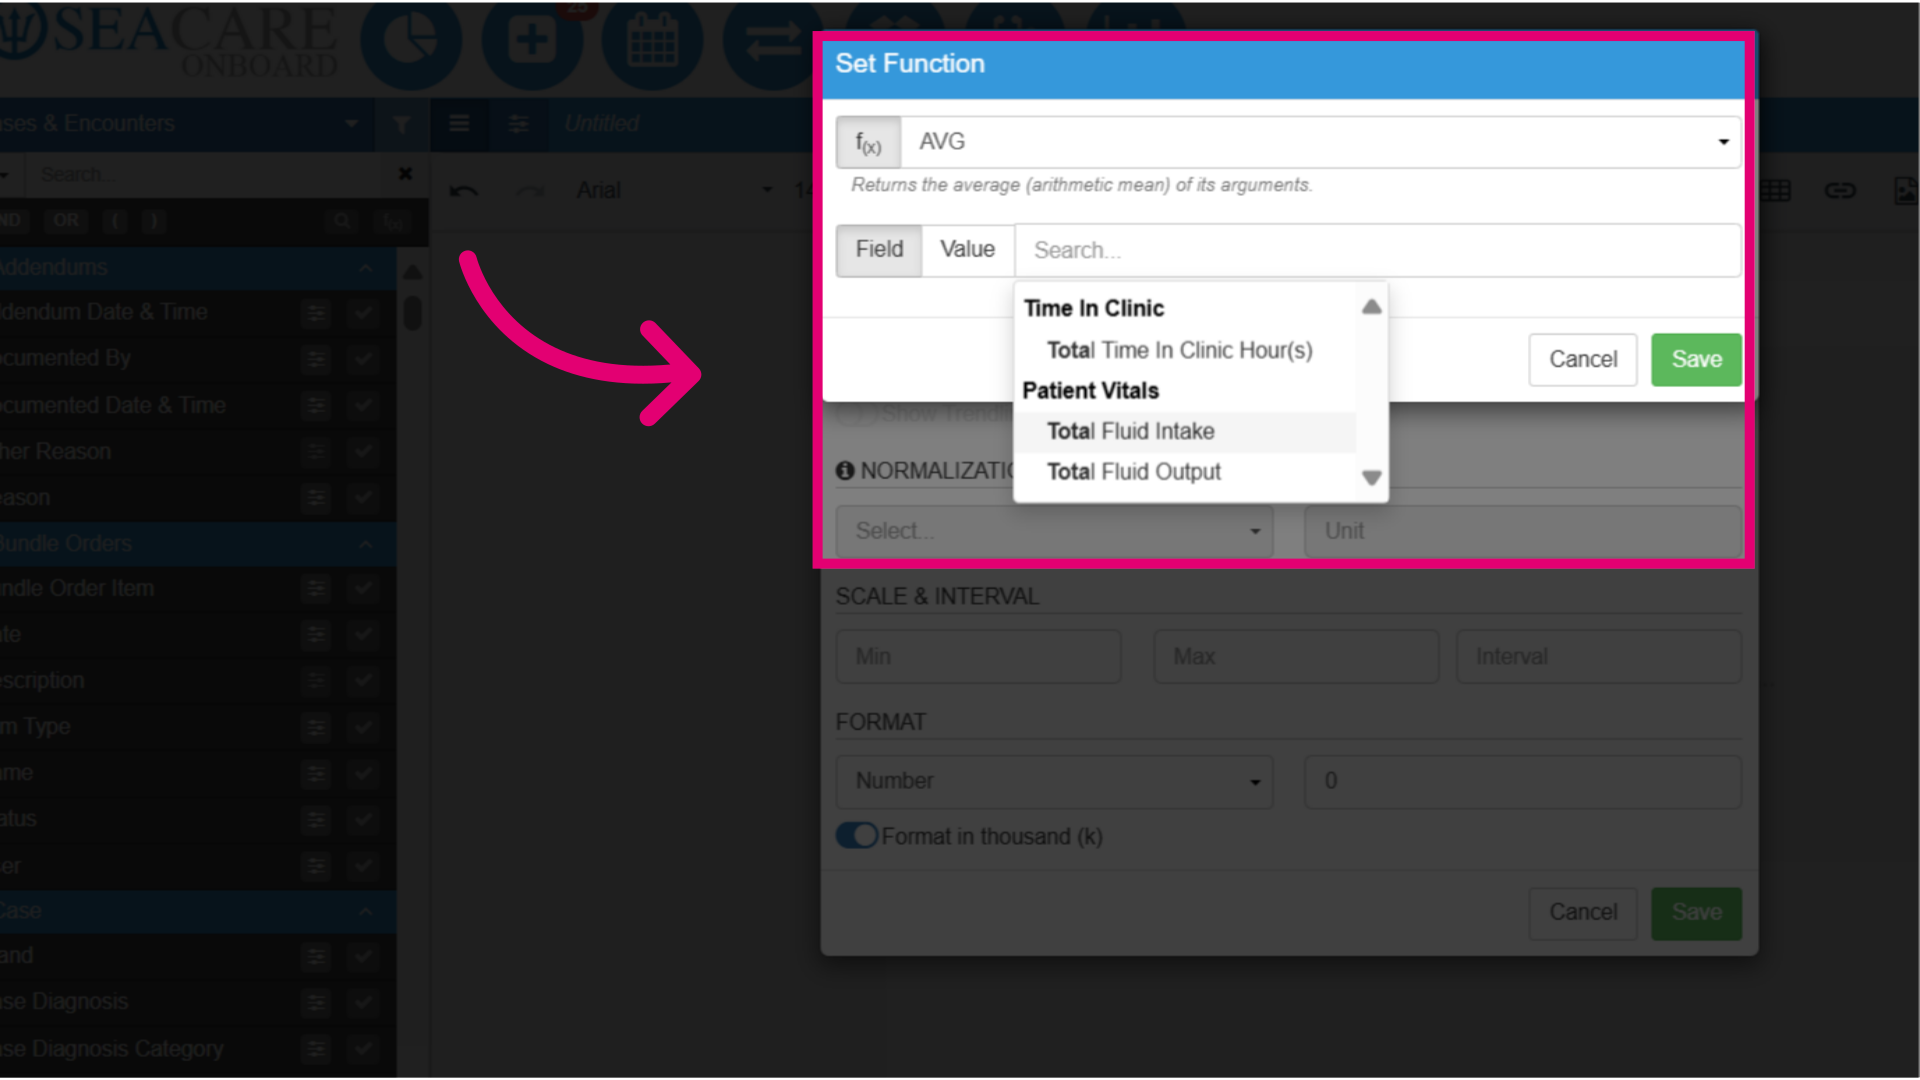
- Set the function by following these steps:
- Choose the function type (e.g. average)
- Add the field or value (Ensure it matches the function; for numerical functions, include a numerical value.)
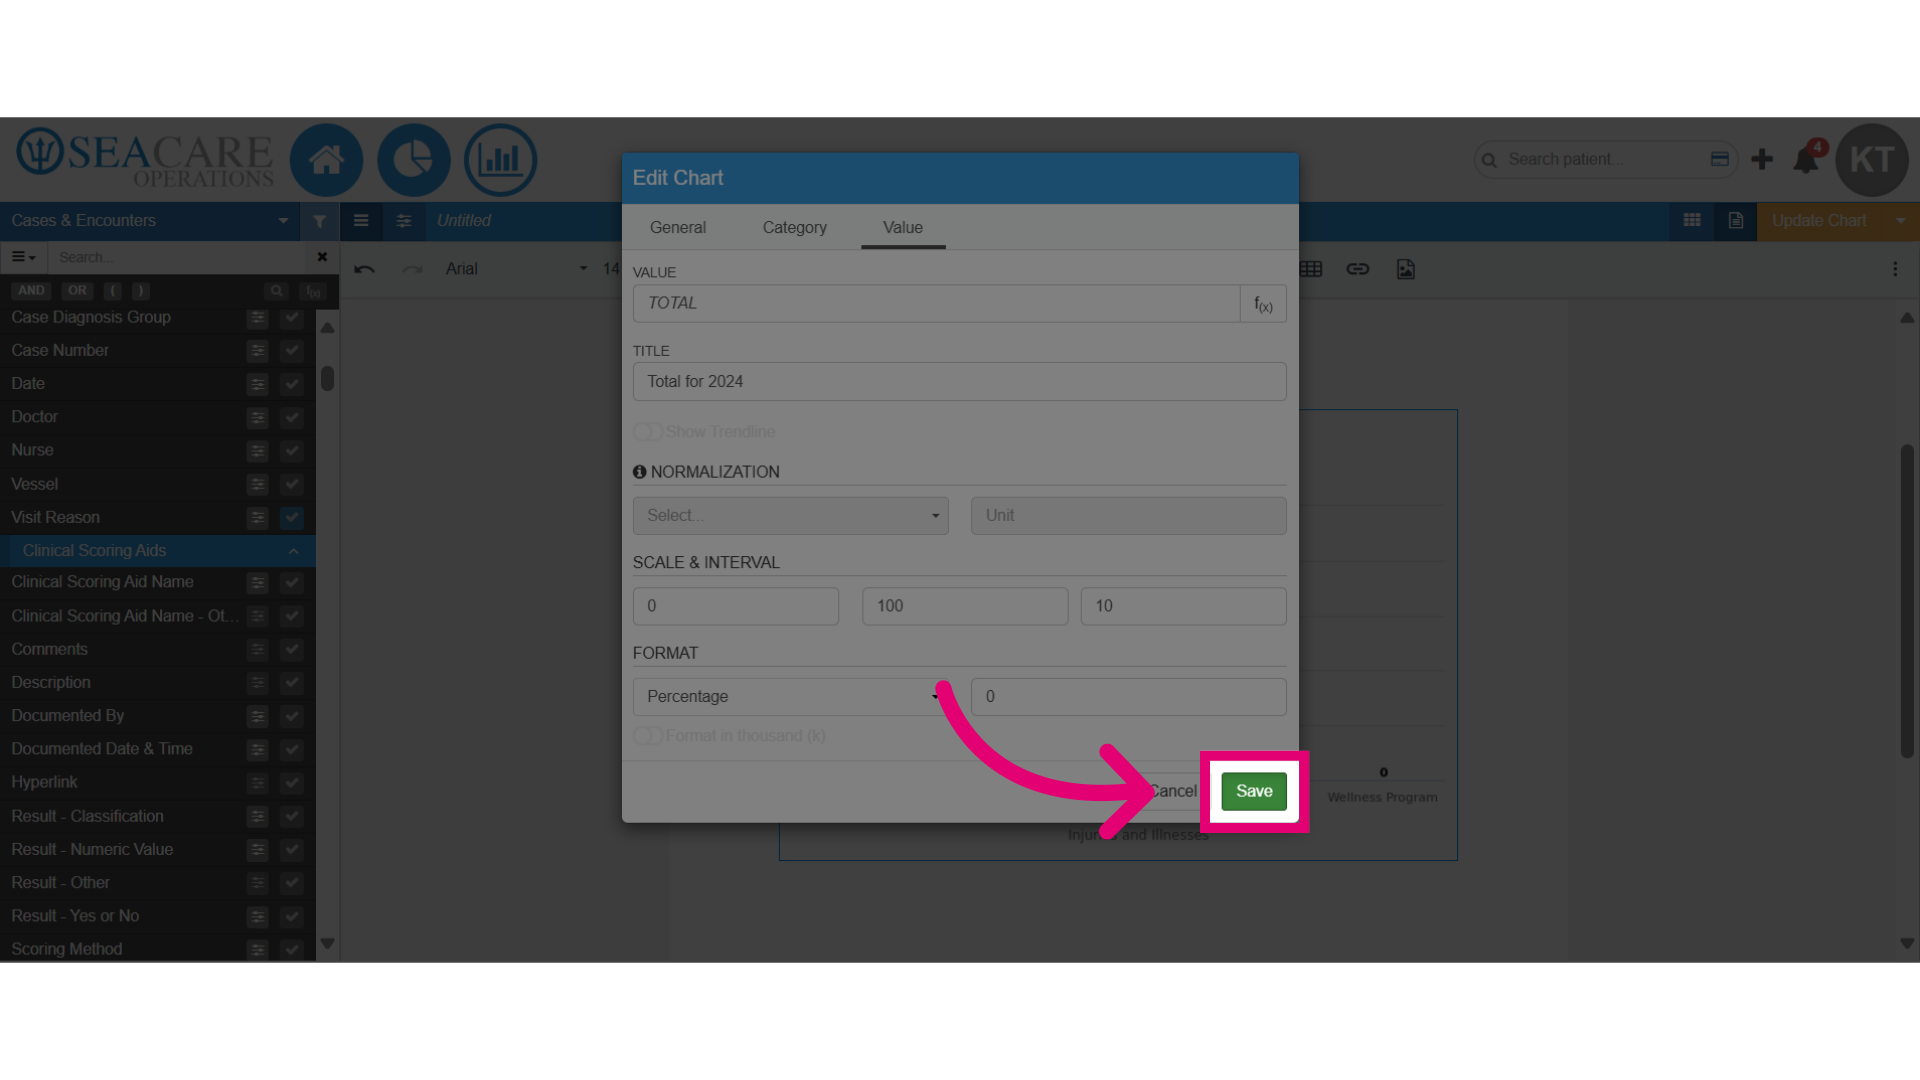
- Select Save.
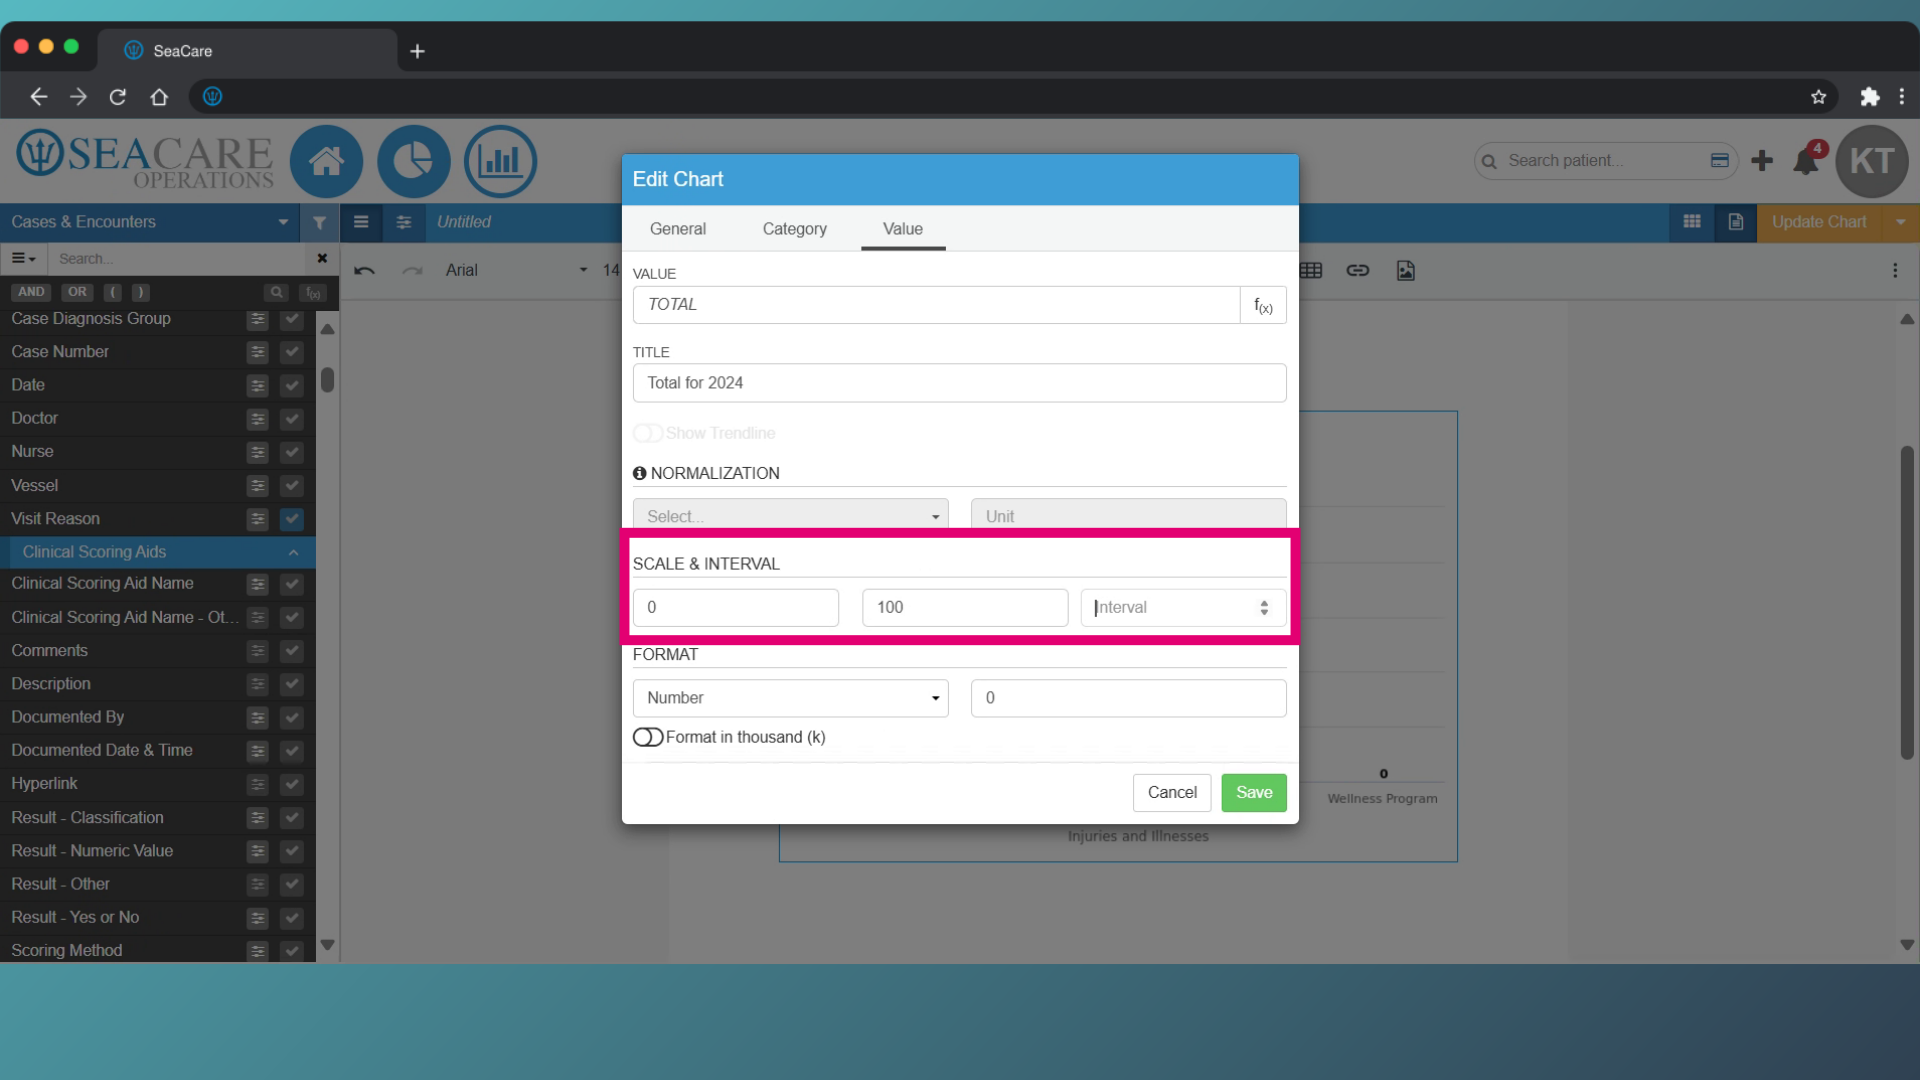
- Add a scale or interval to numerical data for a clearer chart.
- Scale - Sets a maximum number on the chart.
- Interval - Indicates the count between data points (e.g. count by 10s to show points ten units apart).
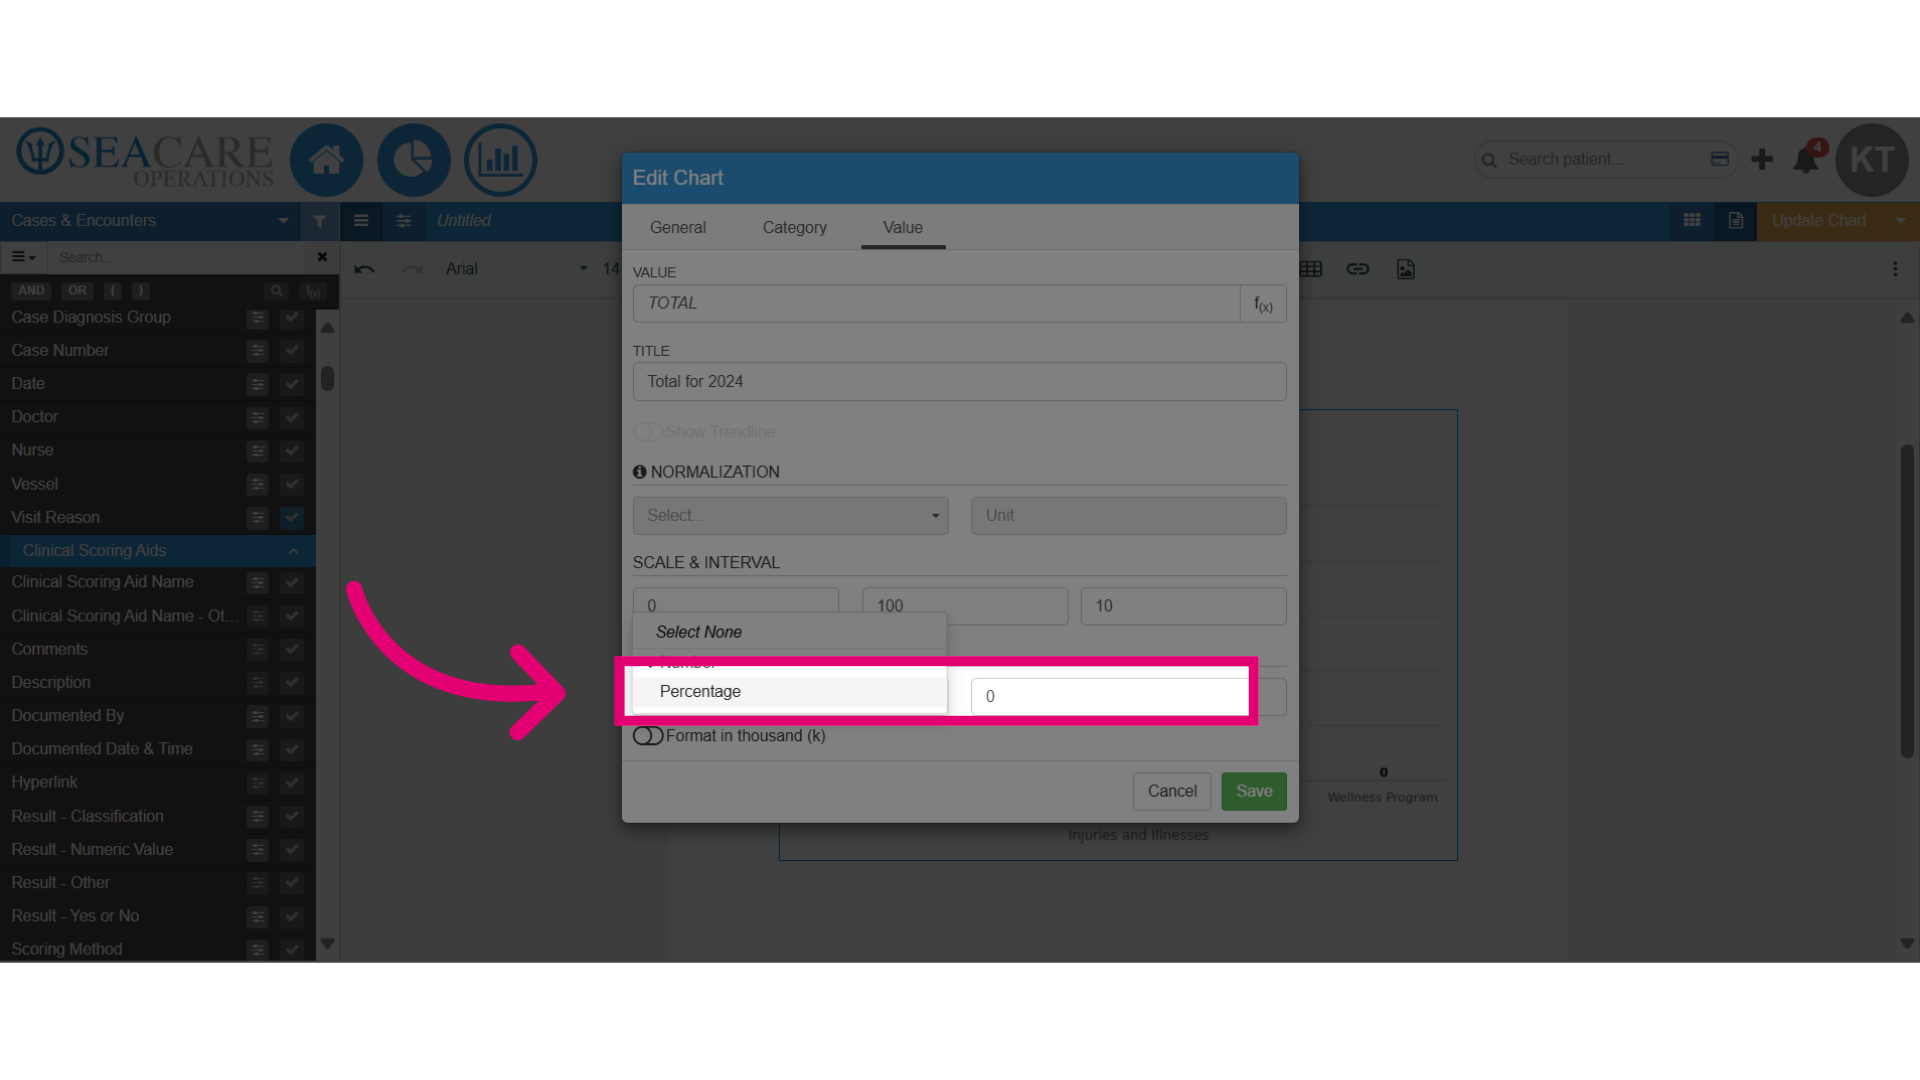
- Select the value format for display on the chart, either as a number or percentage.
- Save the changes made.