New article
Recently updated
Adding Charts in the Document Editor for Custom Reports

Who is this article for?Users who want to learn how to adding charts in the Document Editor for Custom Reports.
No elevated permissions are required.
This guide provides clear instructions to effortlessly integrate charts into your reports for better visualization and analysis. Enhance your document editing experience by adding charts in the Custom Report Document Editor.
1. Adding Charts in the Document Editor for Custom Reports
1.1. Video
1.2. Steps
- Start in the Document Editor section of the Build Custom Report module.
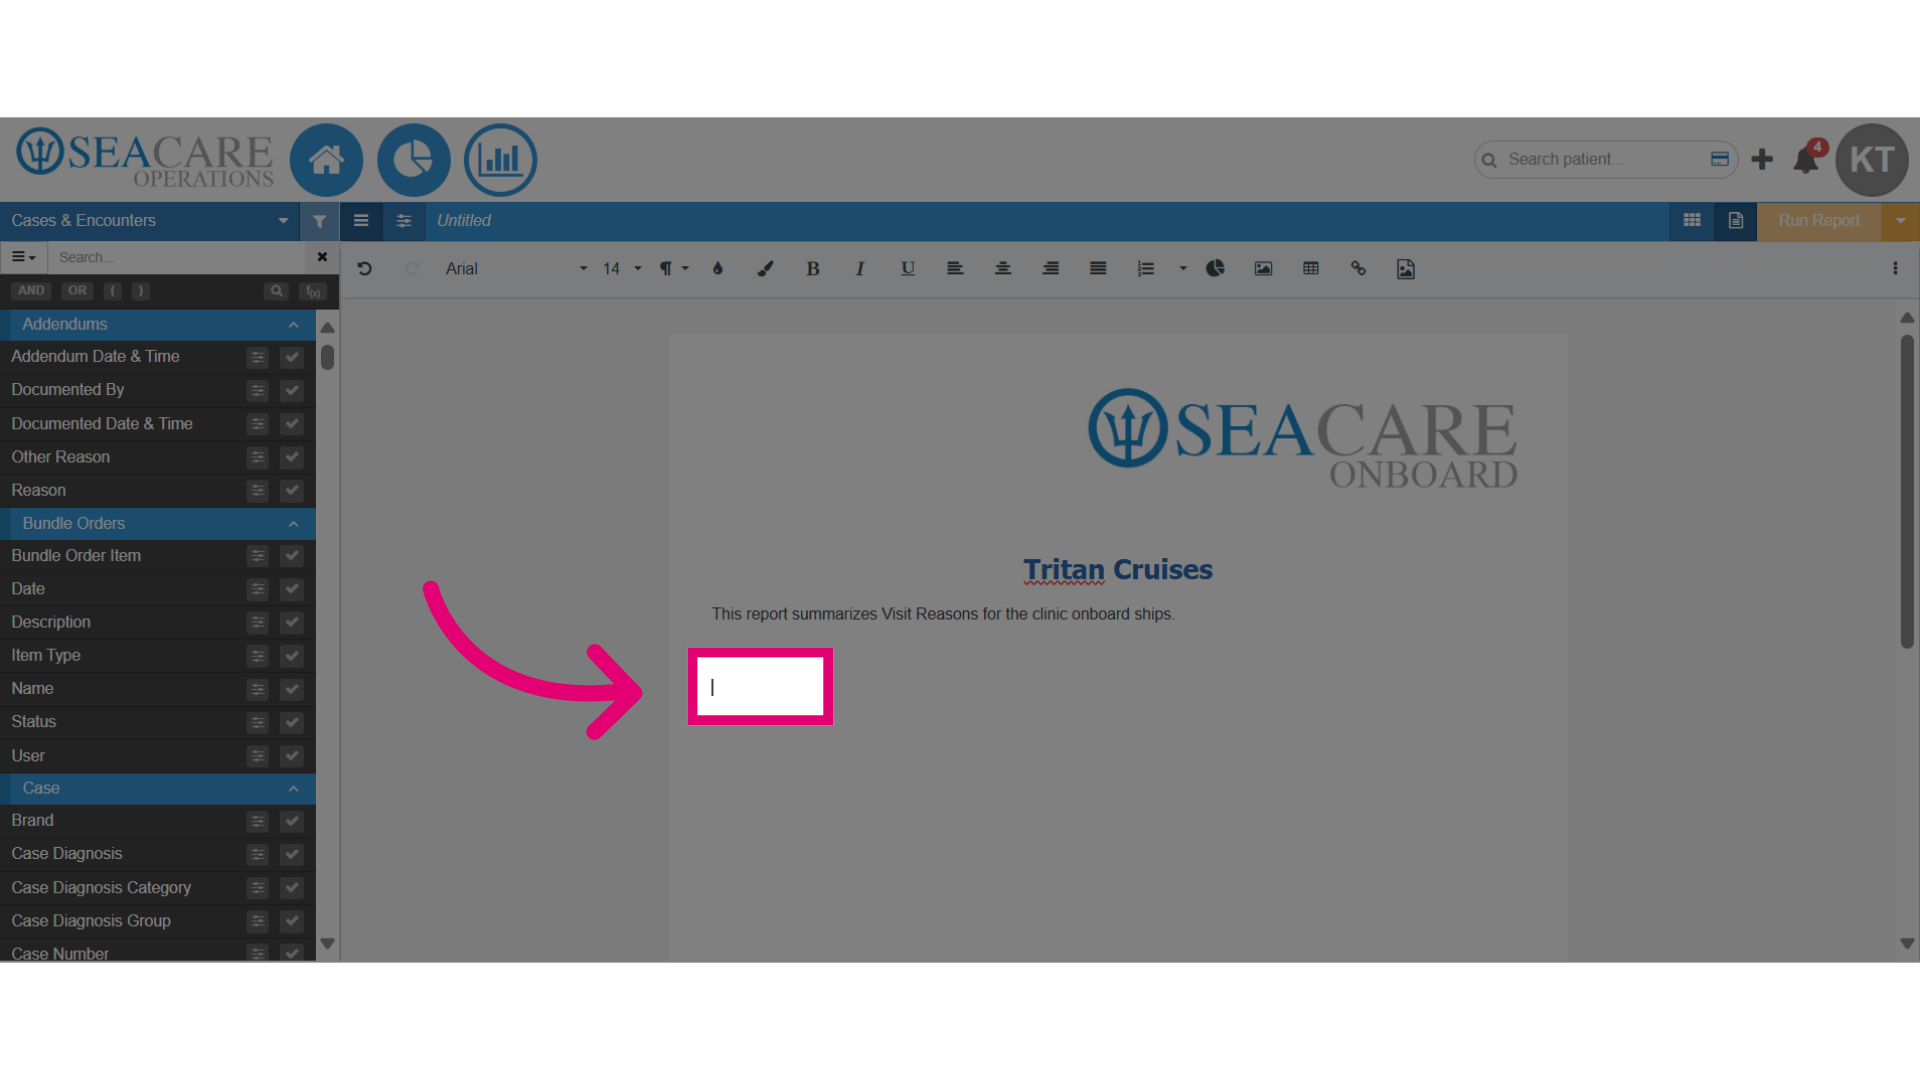
- Click on the location on the document where you want the chart to go.
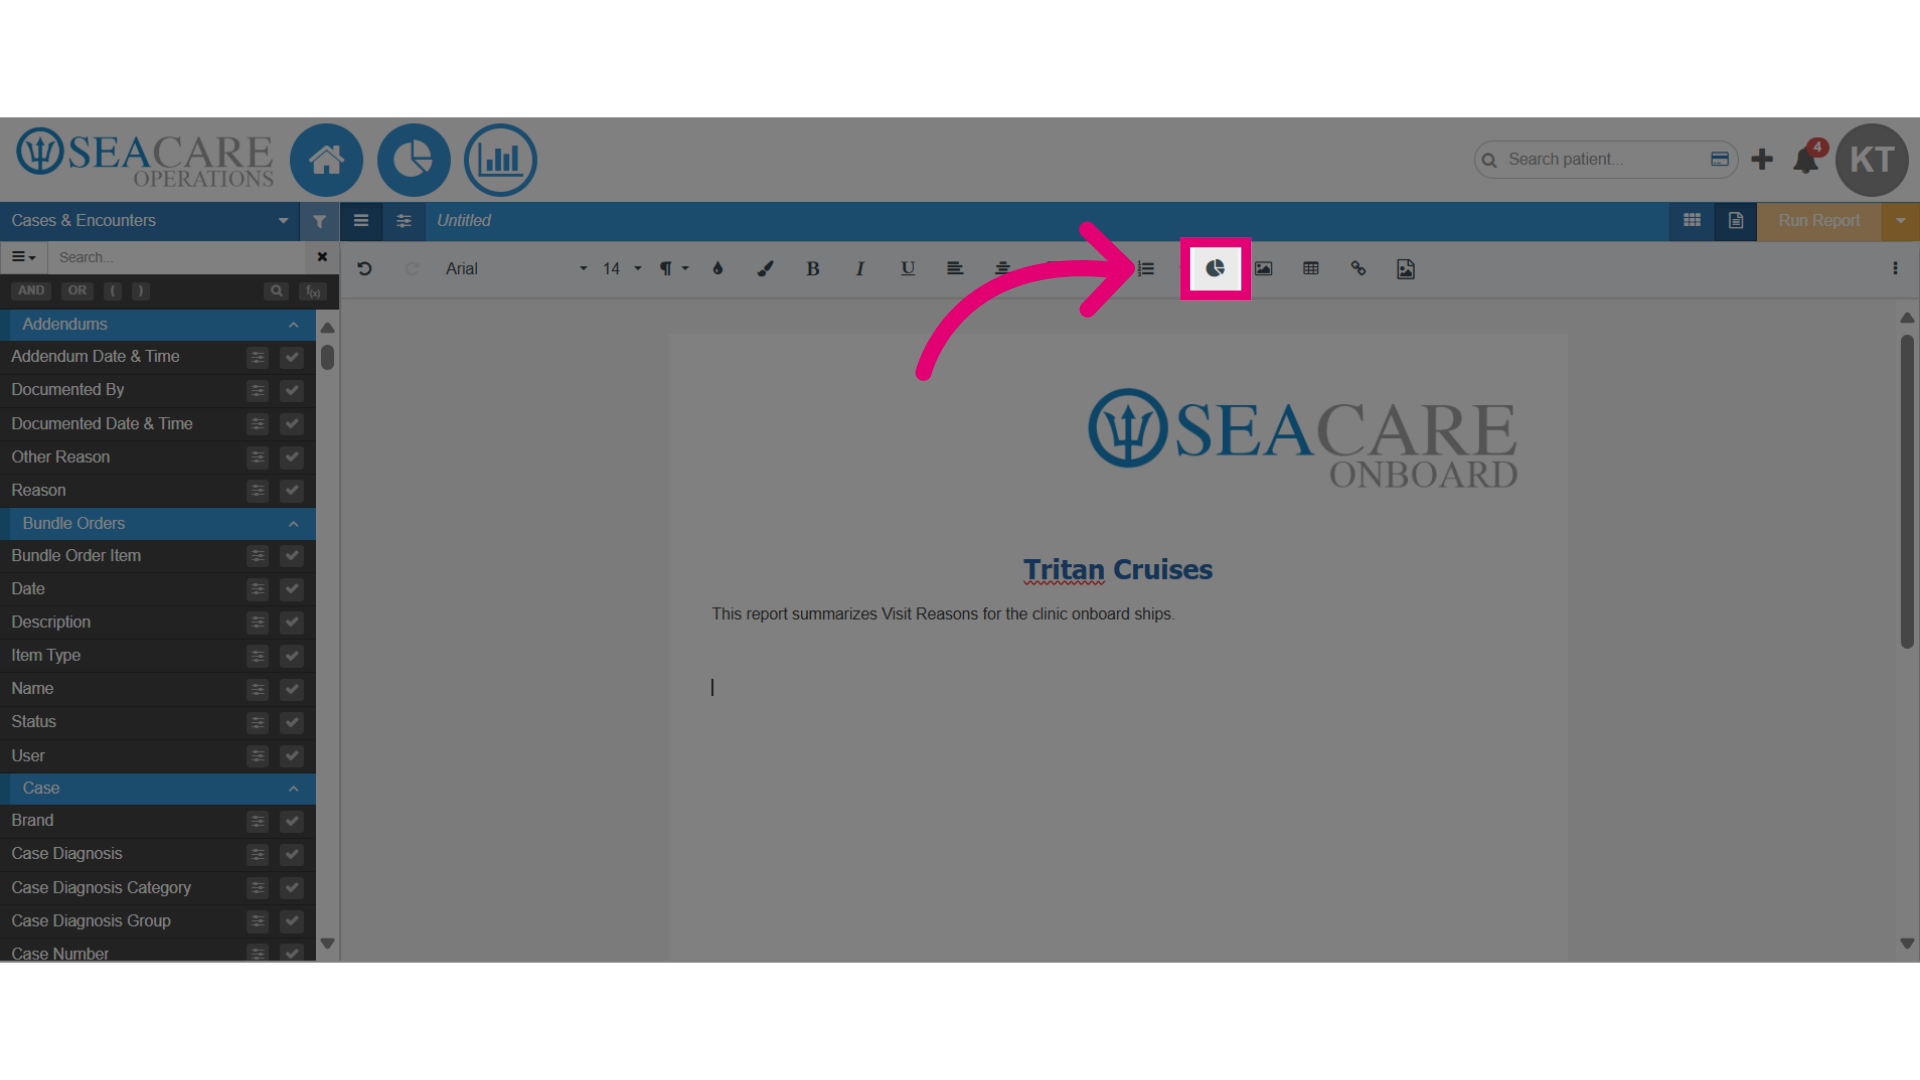
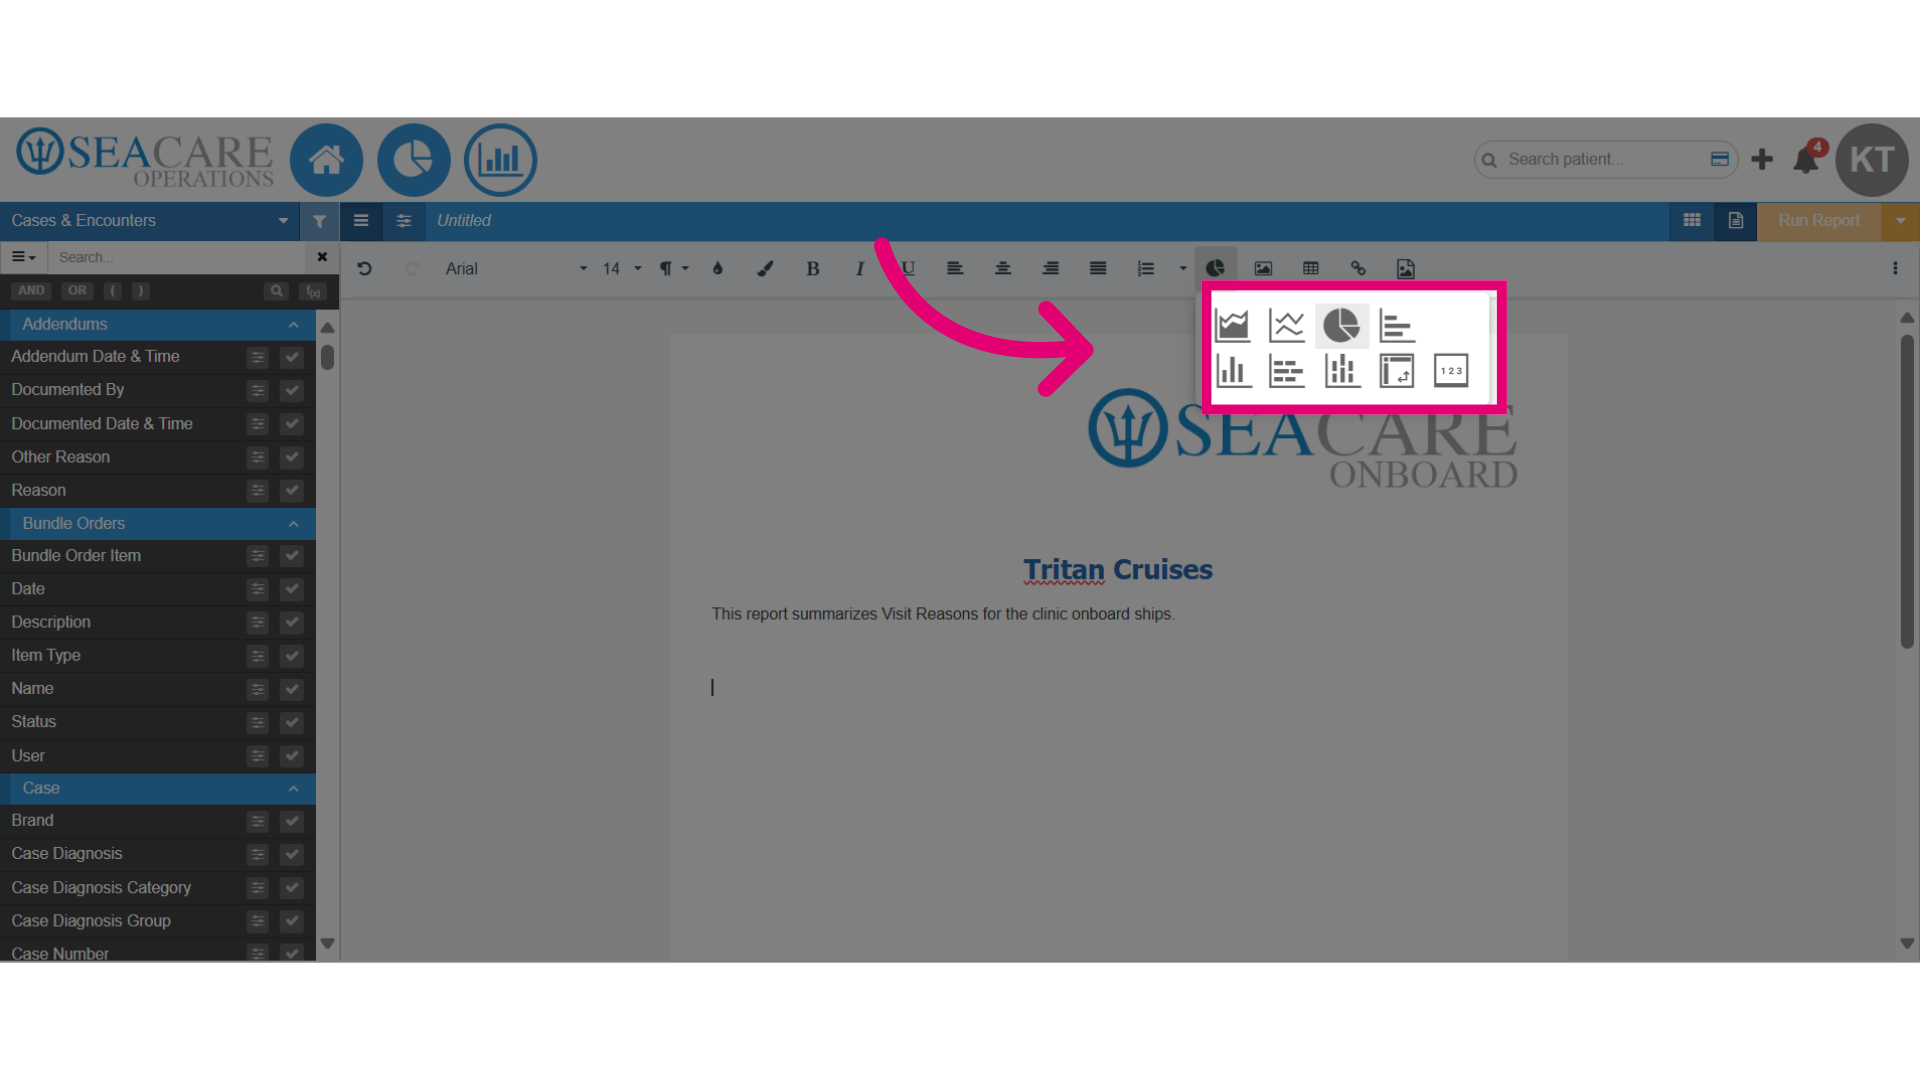
- Next, select the Chart button in the formatting toolbar.
- Then, select a chart from the selection from these options:
- Choose from an Area
- Line
- Pie
- Stacked Bar
- Bar
- Stacked Column
- Pivot Table
- Card
All chart types allow you to add one data field except the Stacked Bar and Stacked Column, which allows you to add two data fields to the chart.
- Select the chart and it will be instantly added to the document.
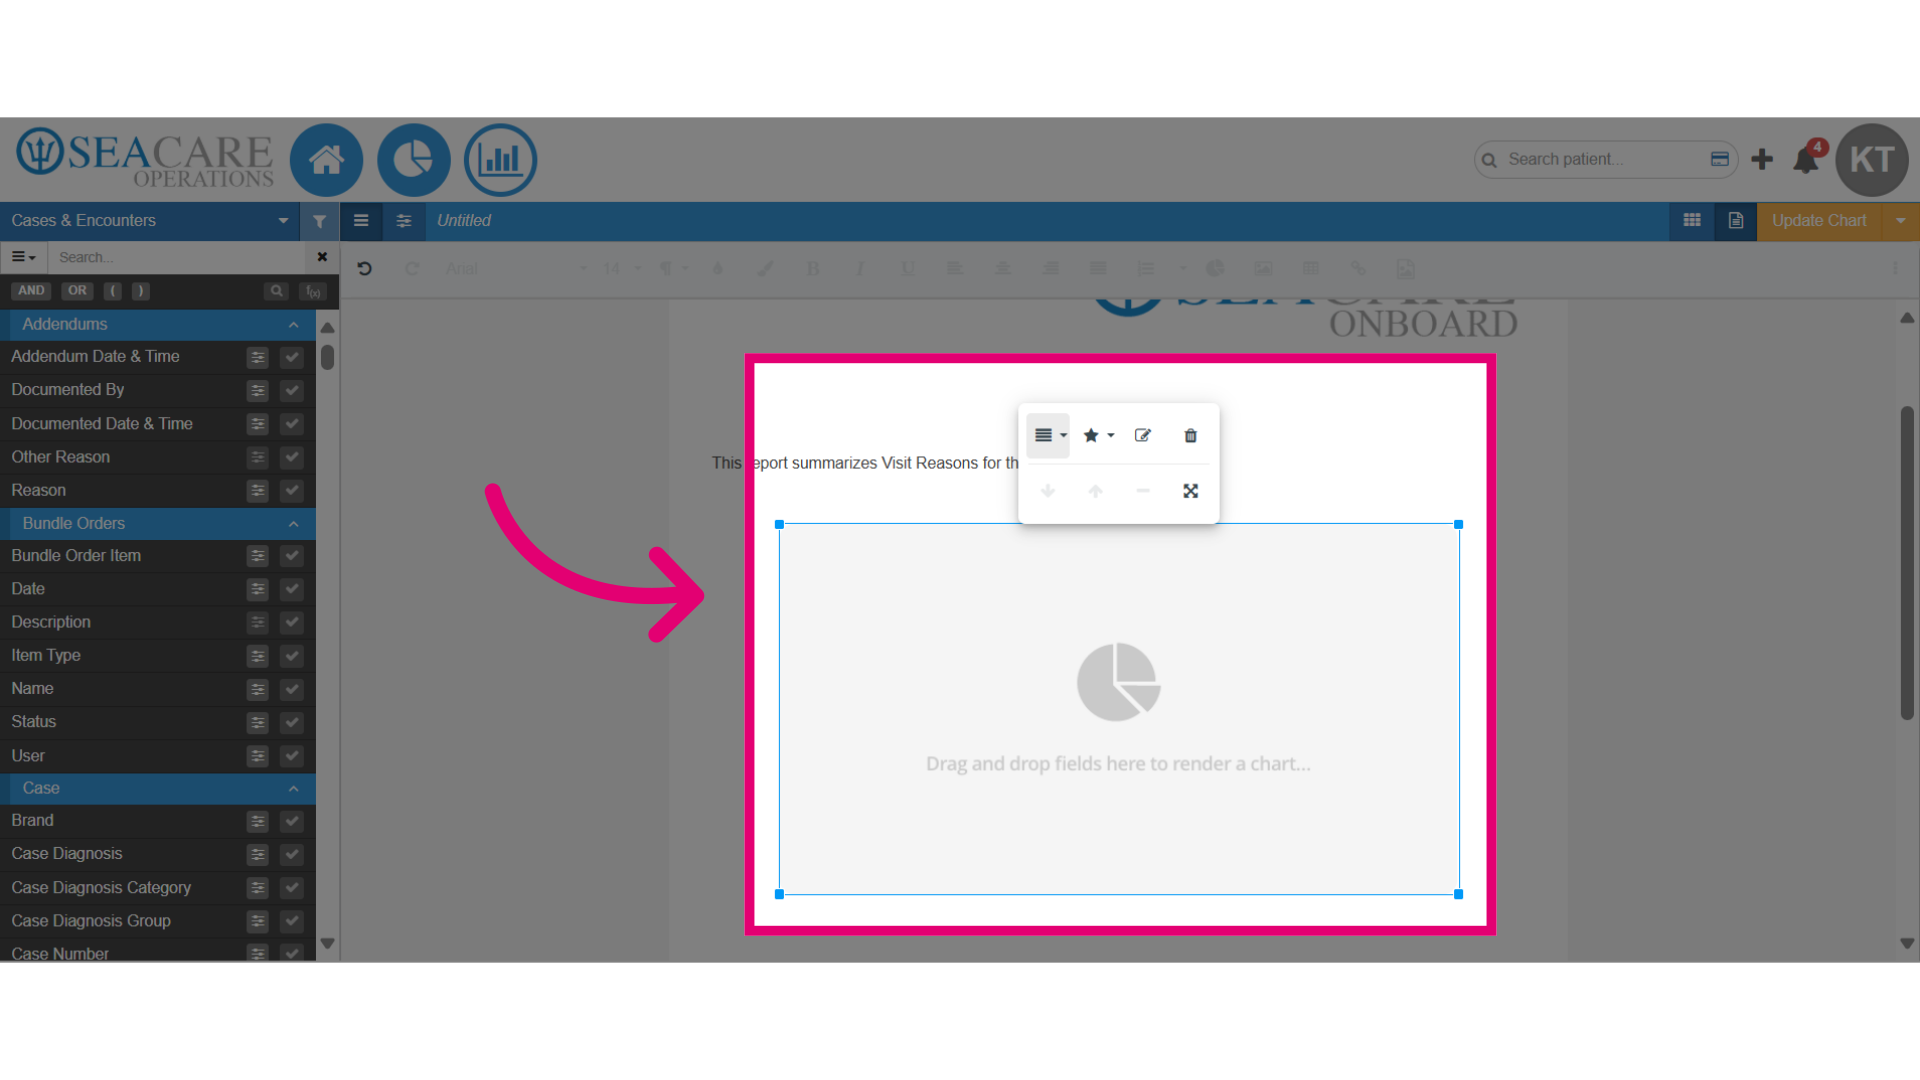
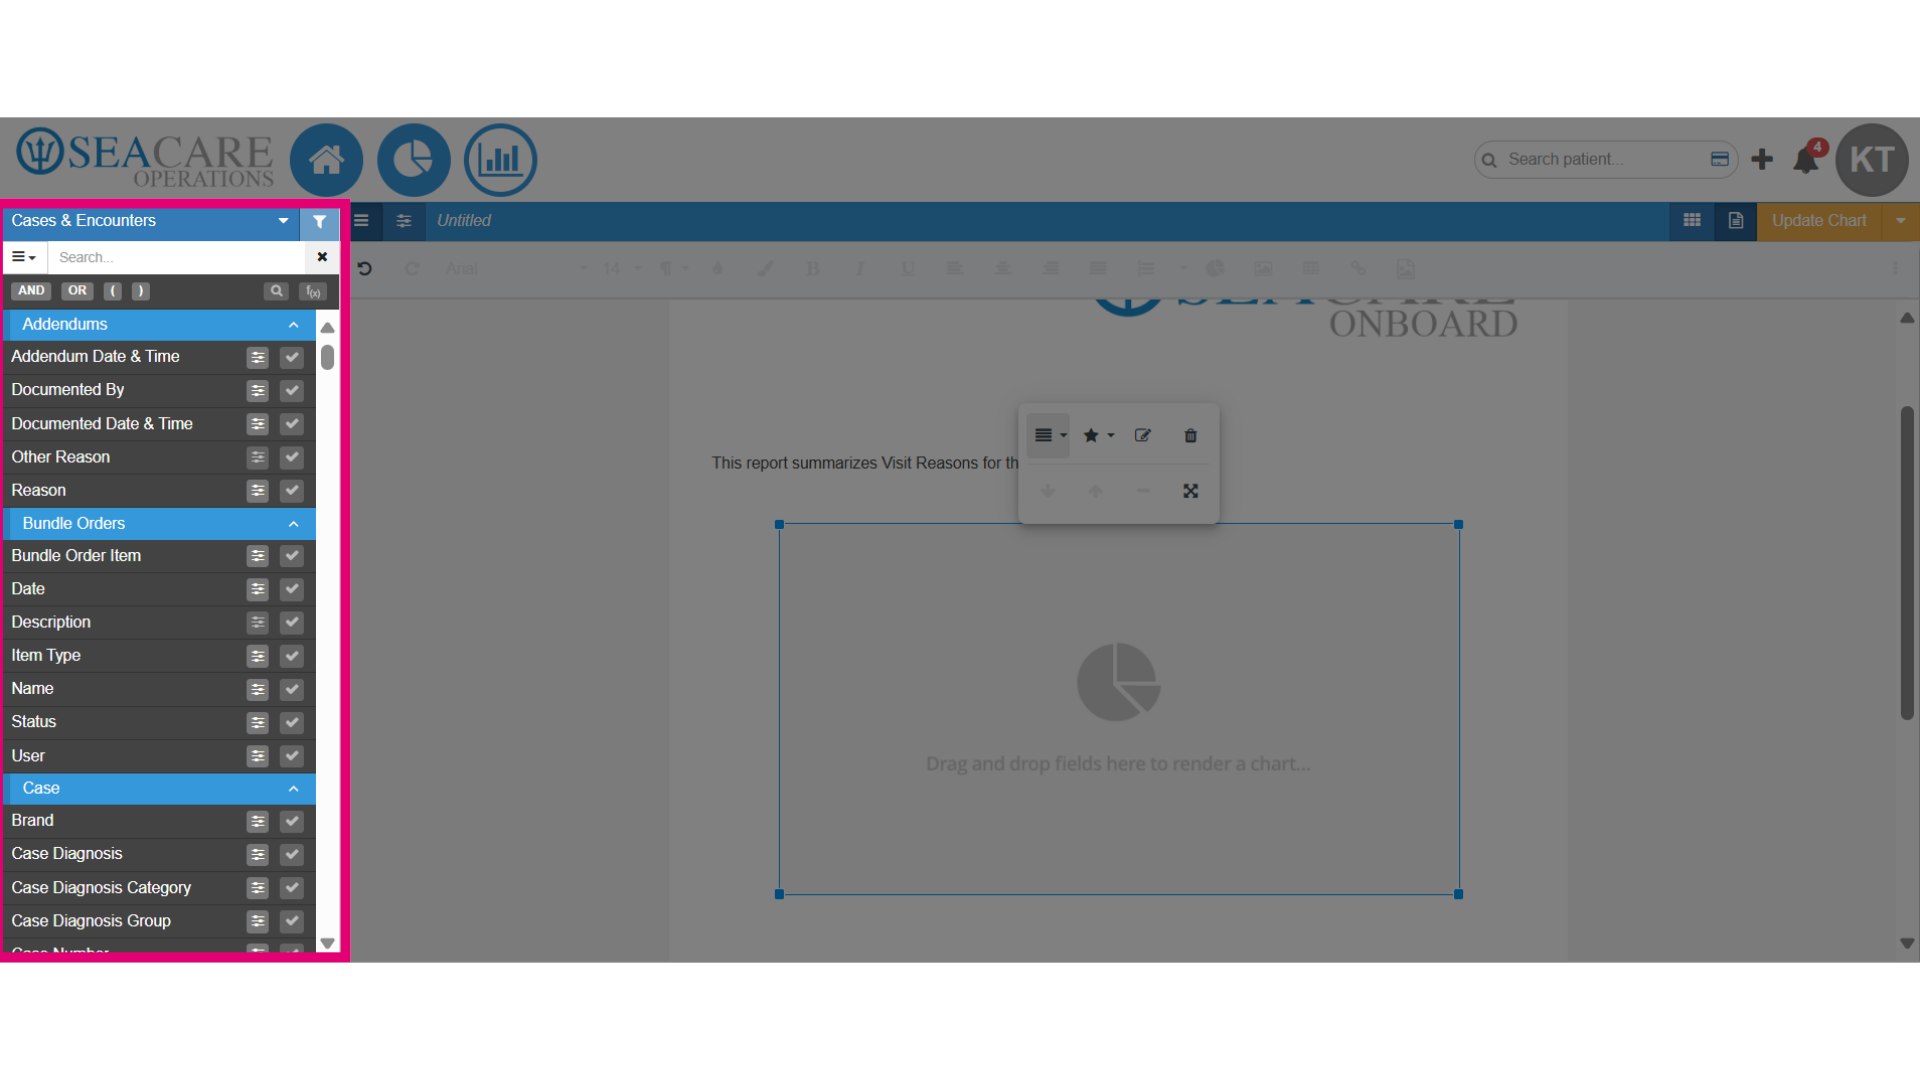
- Add one data field from the reporting area to the chart to visualize that data area on the chart.
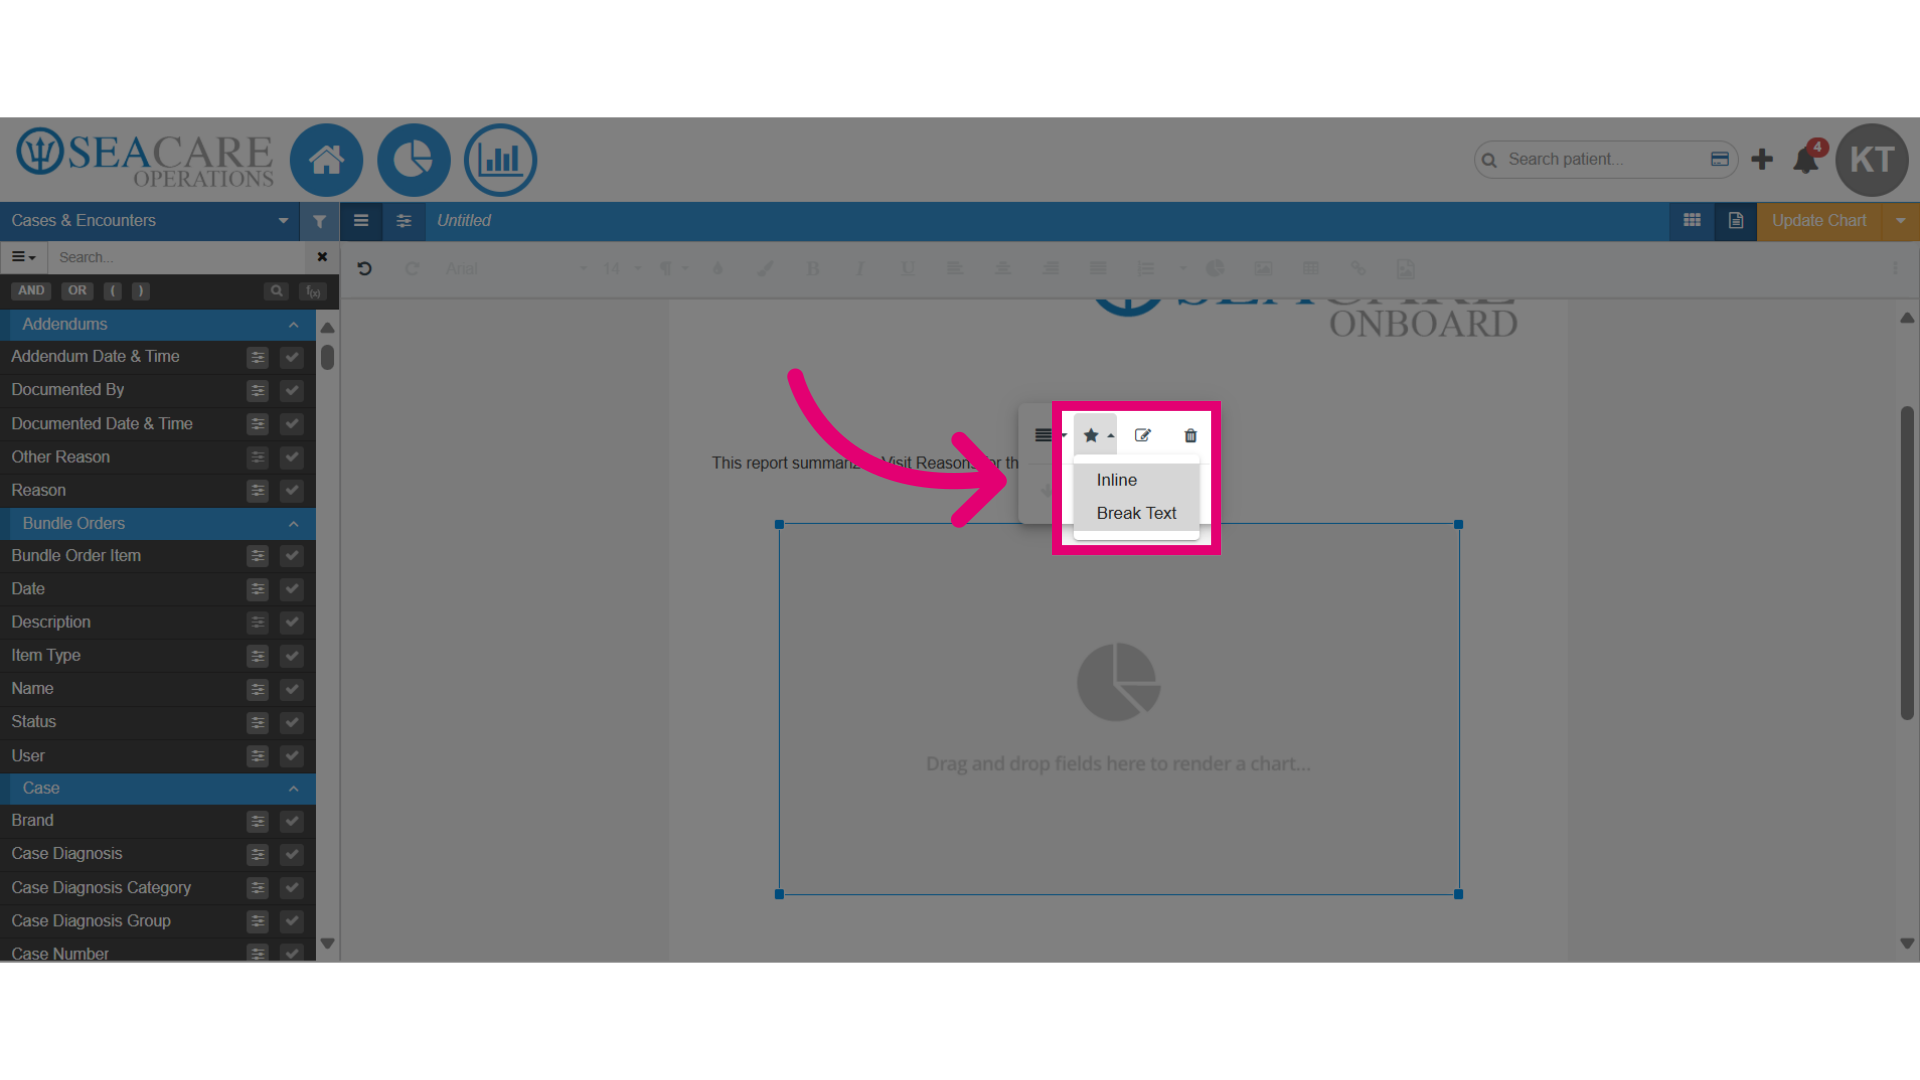
- Click on the editing features to format the chart on the document.
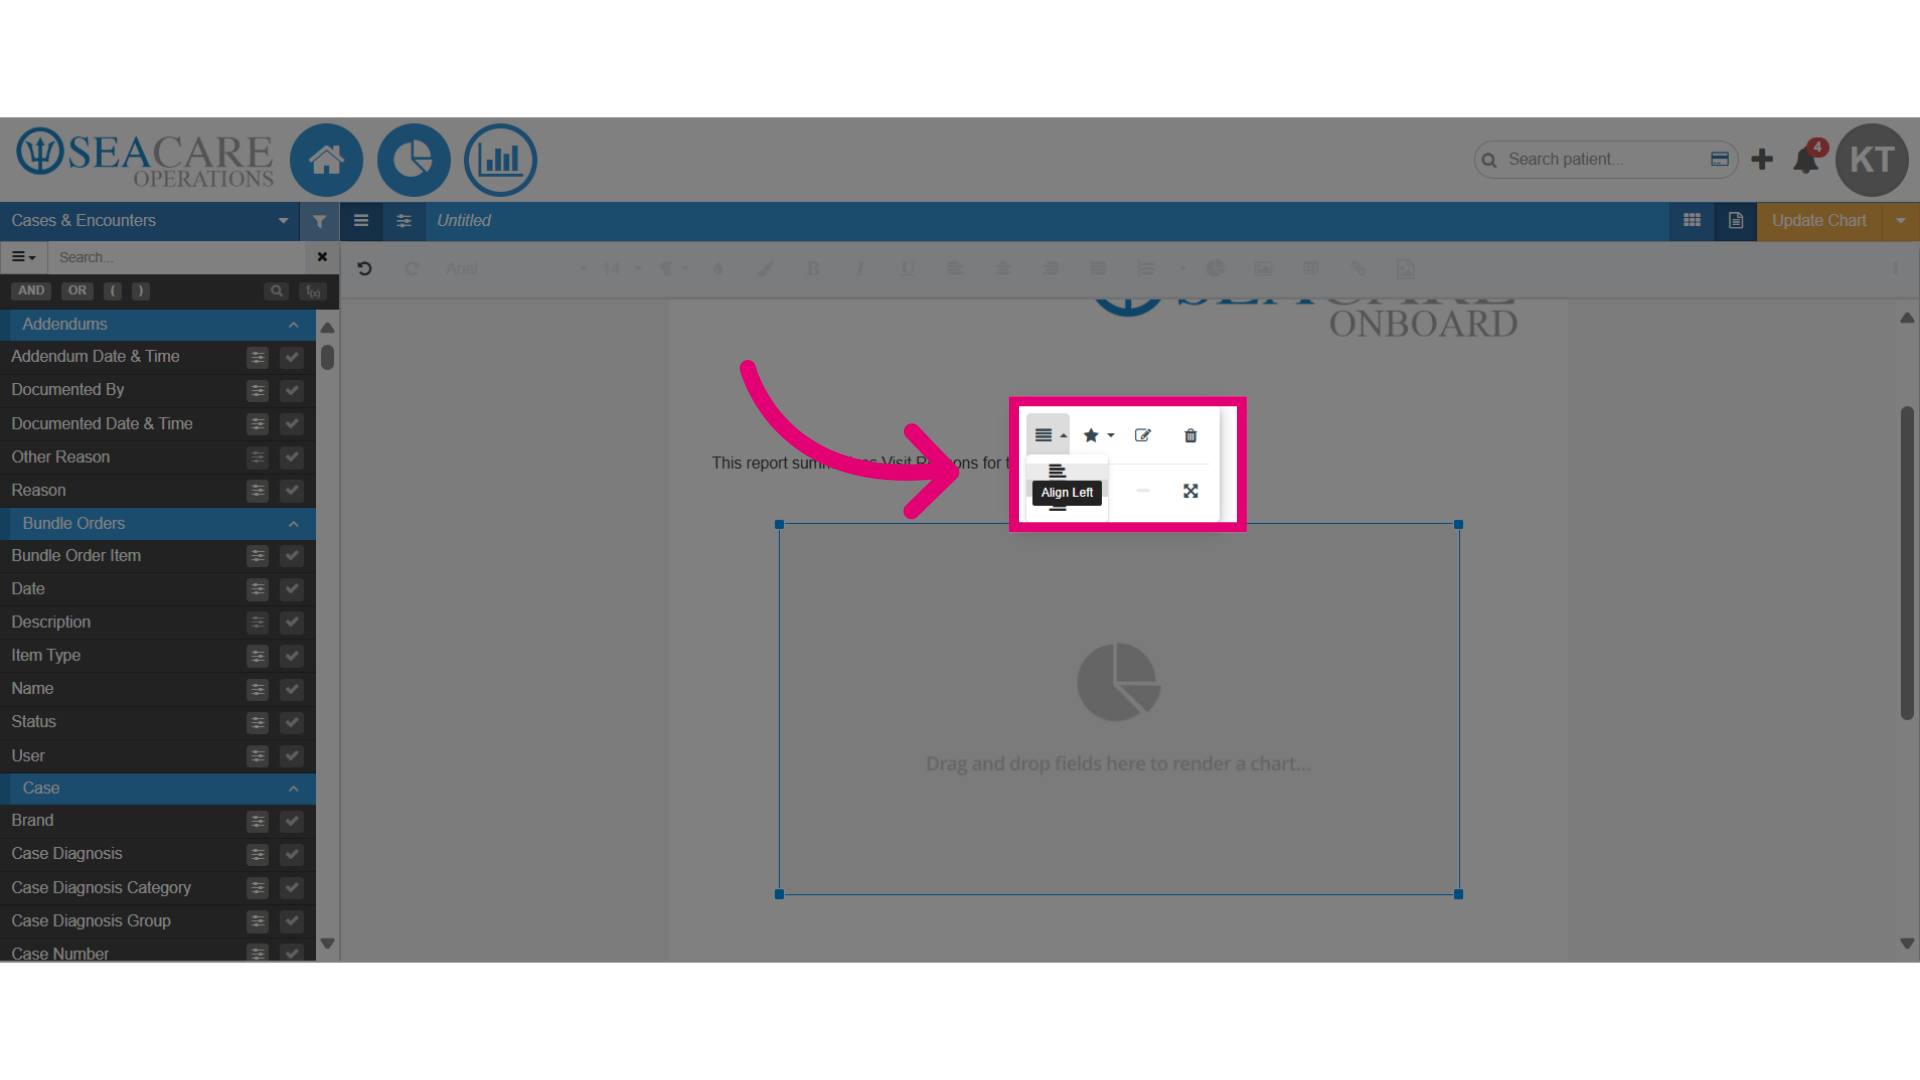
- Select Display from the menu options to adjust how the chart is displayed on the document as Inline or Break Text.
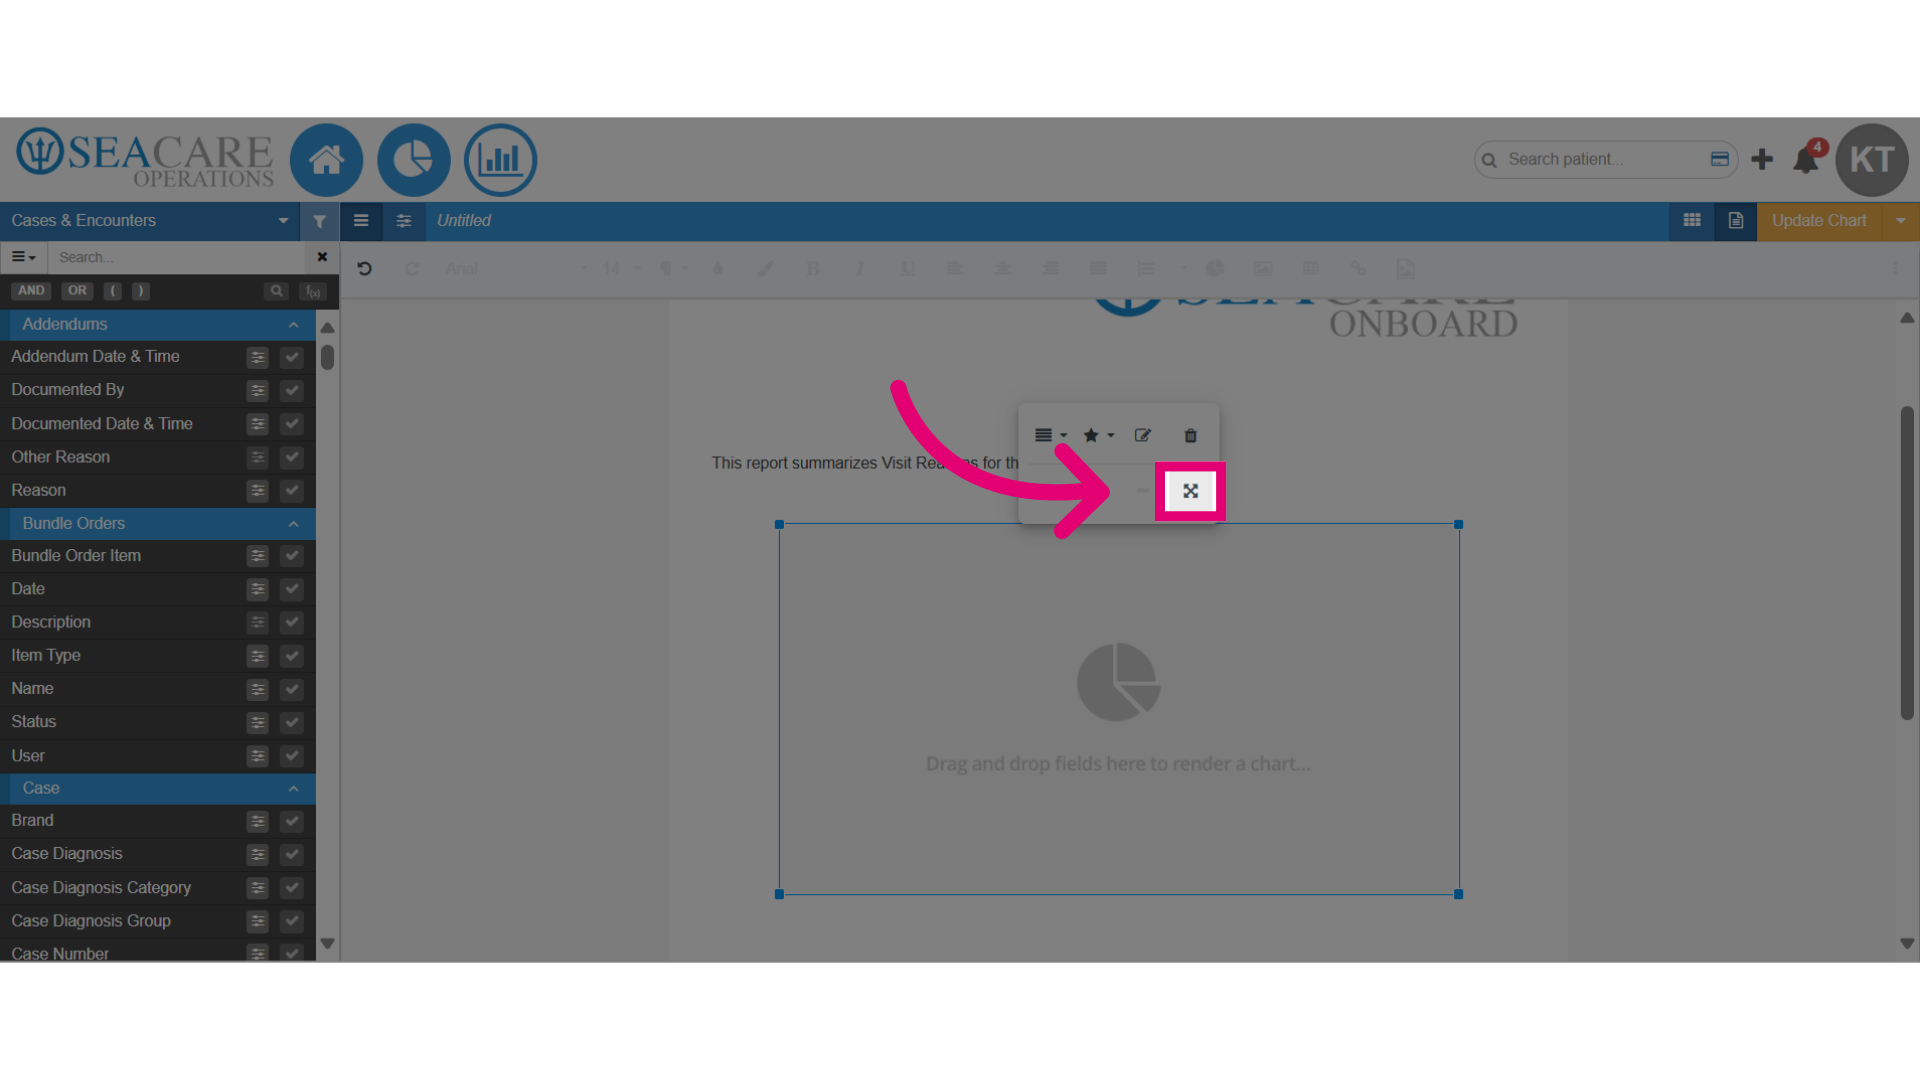
- Select the Resize button to change the size of the chart.
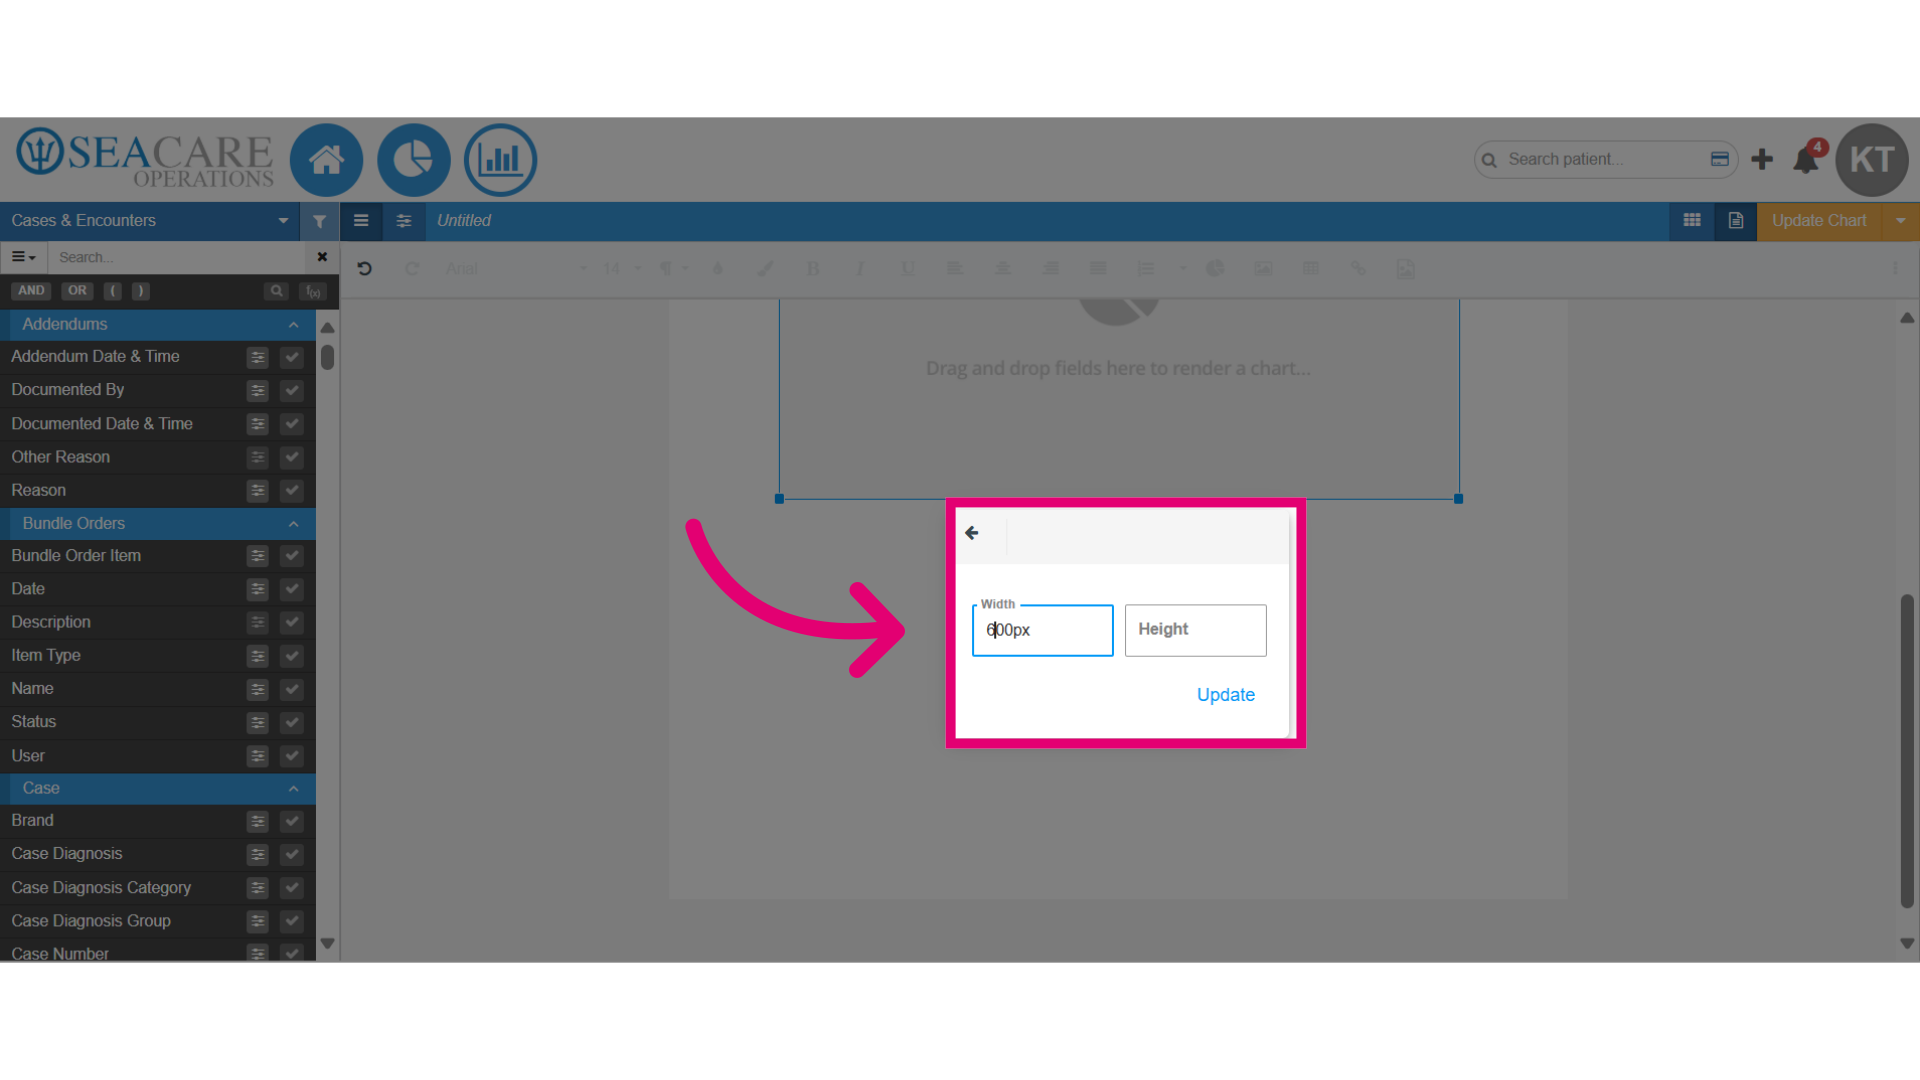
- Change the number of the width or height to adjust the size on the document.
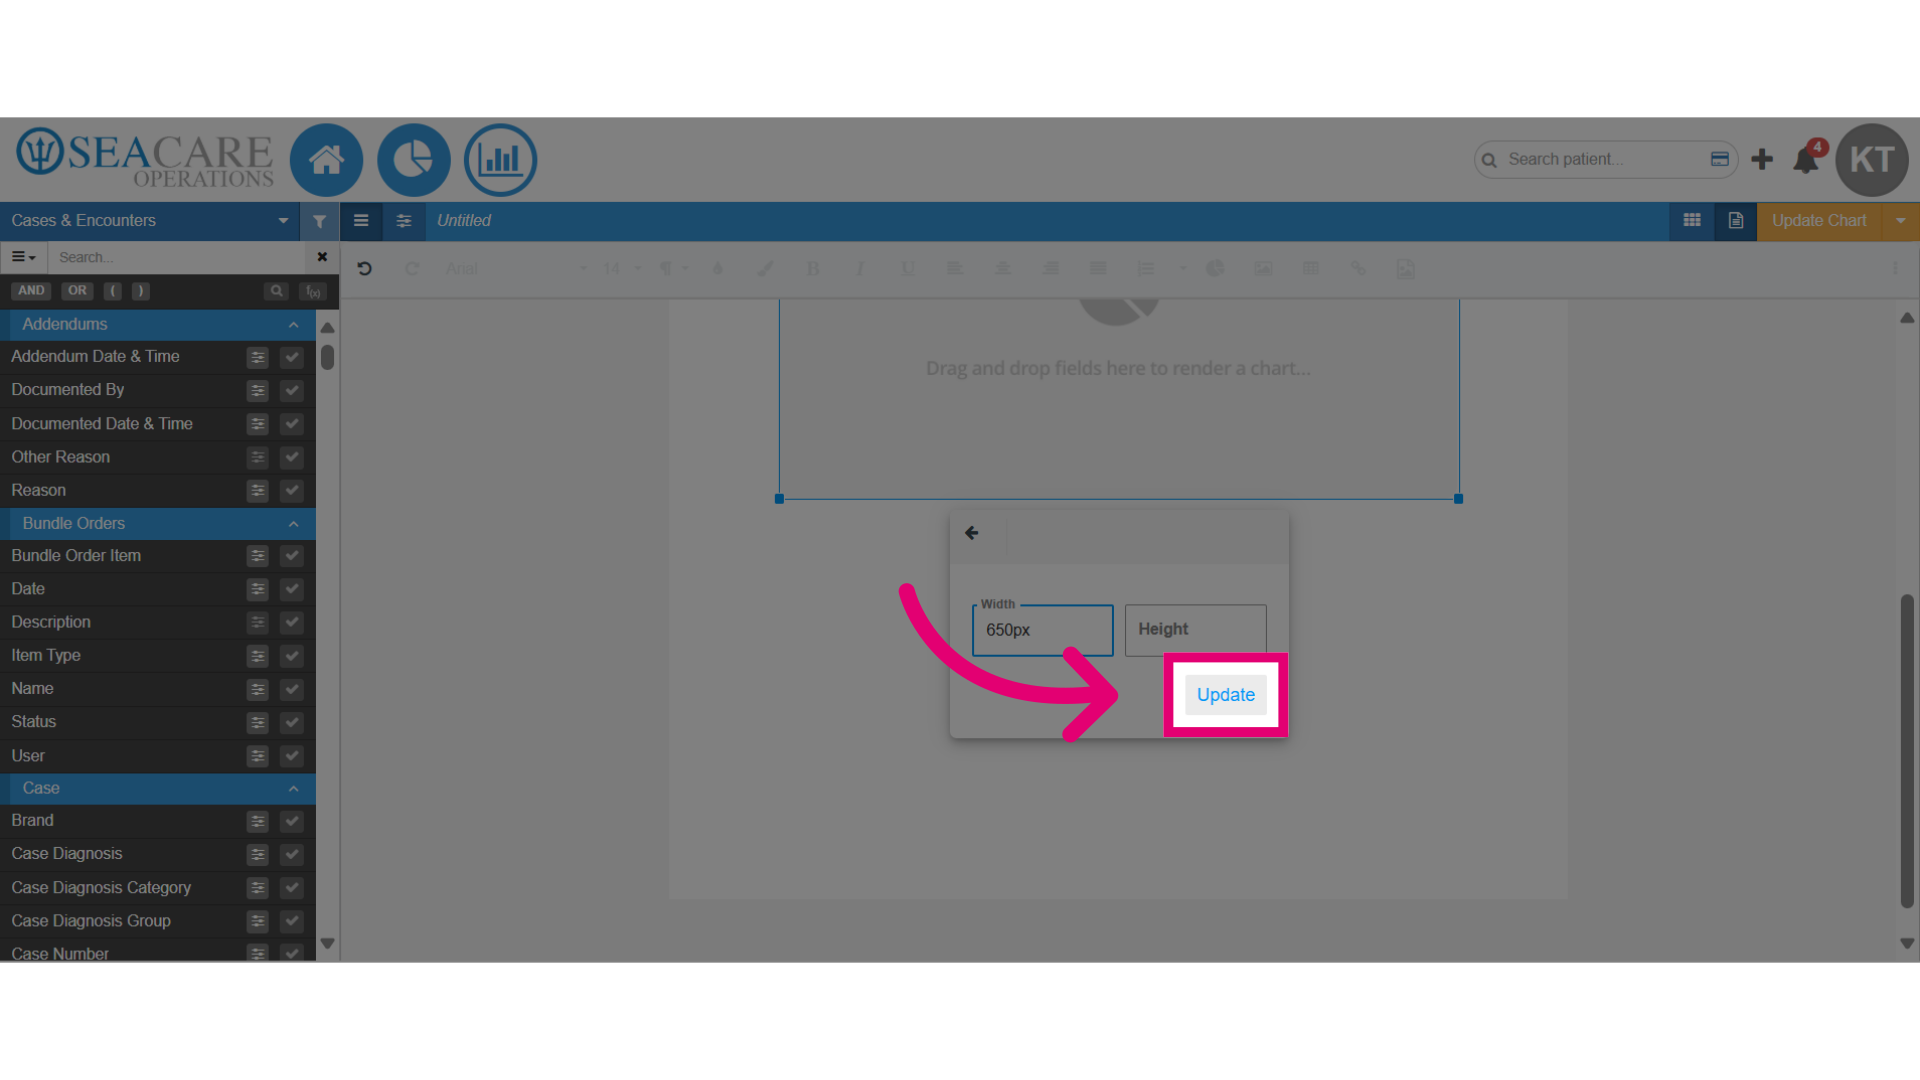
- Then select Update.
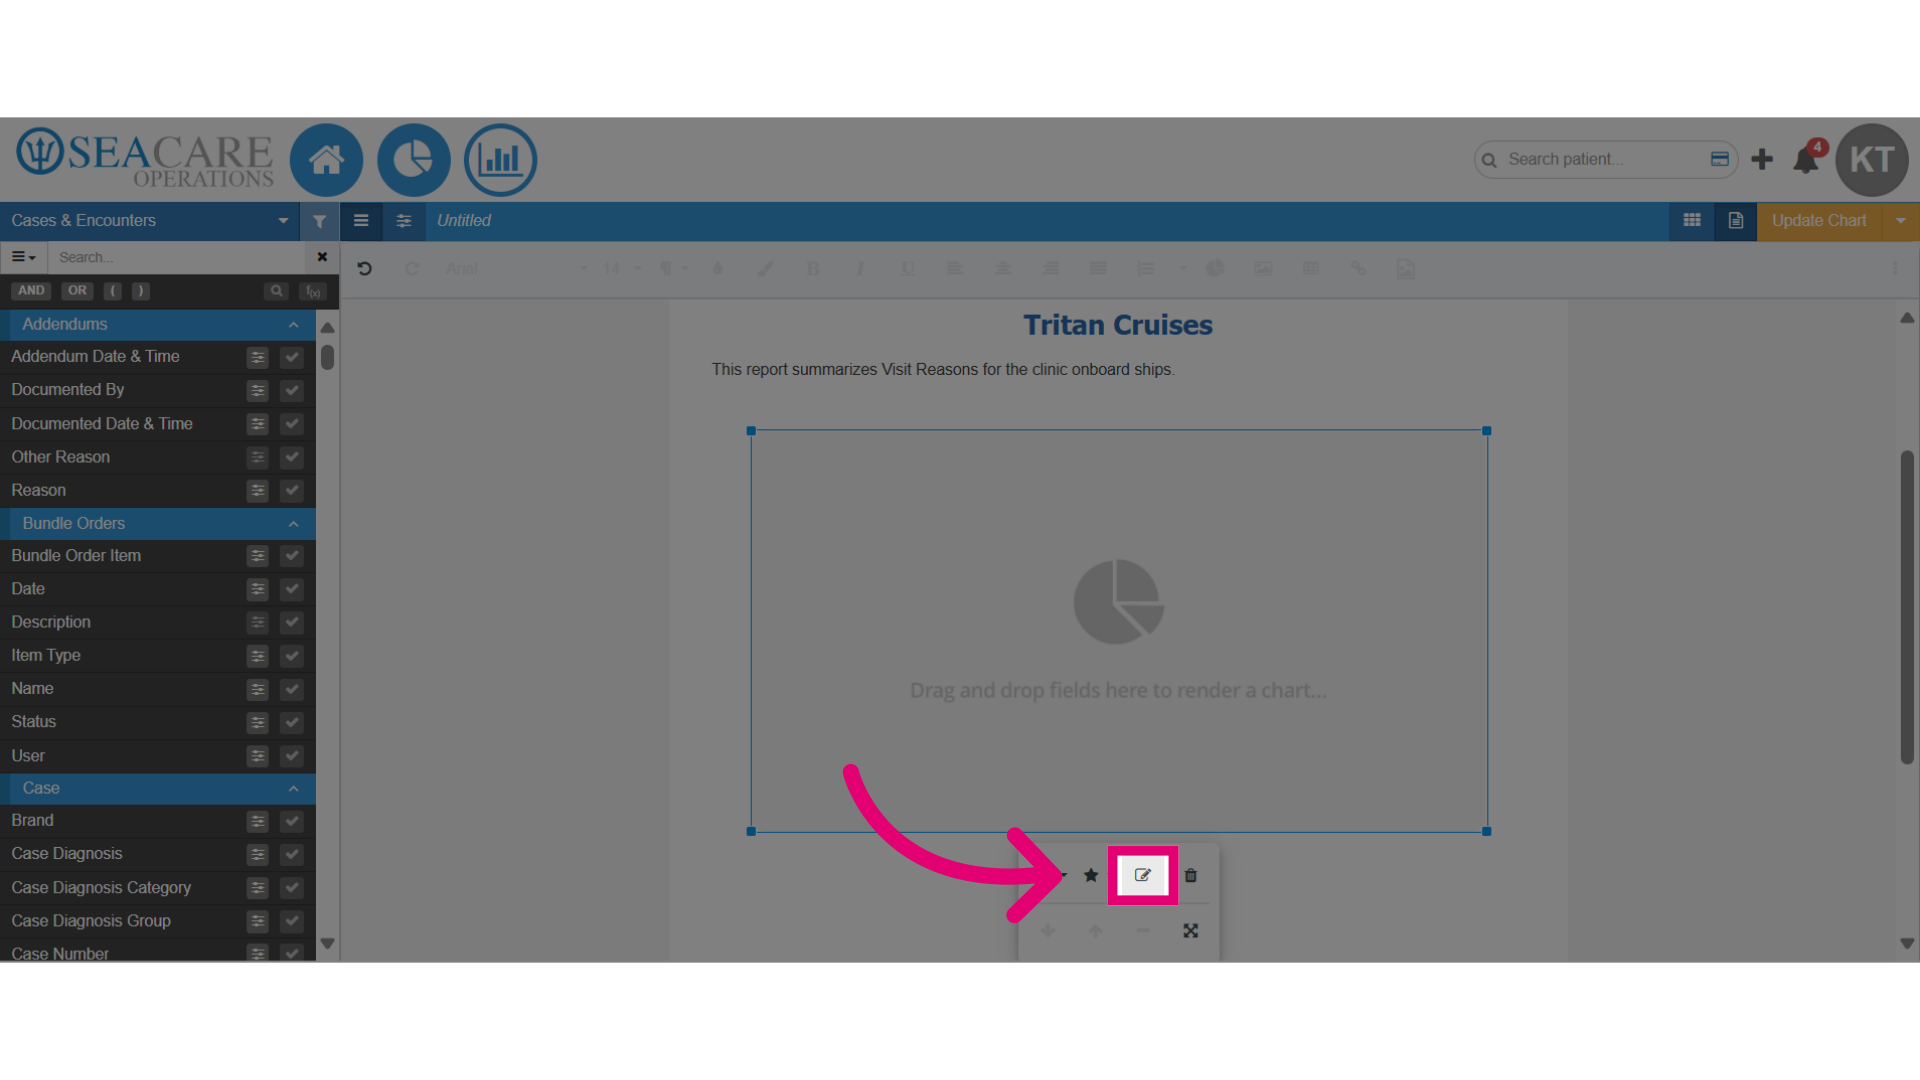
- Select the Edit pencil button for more editing options.
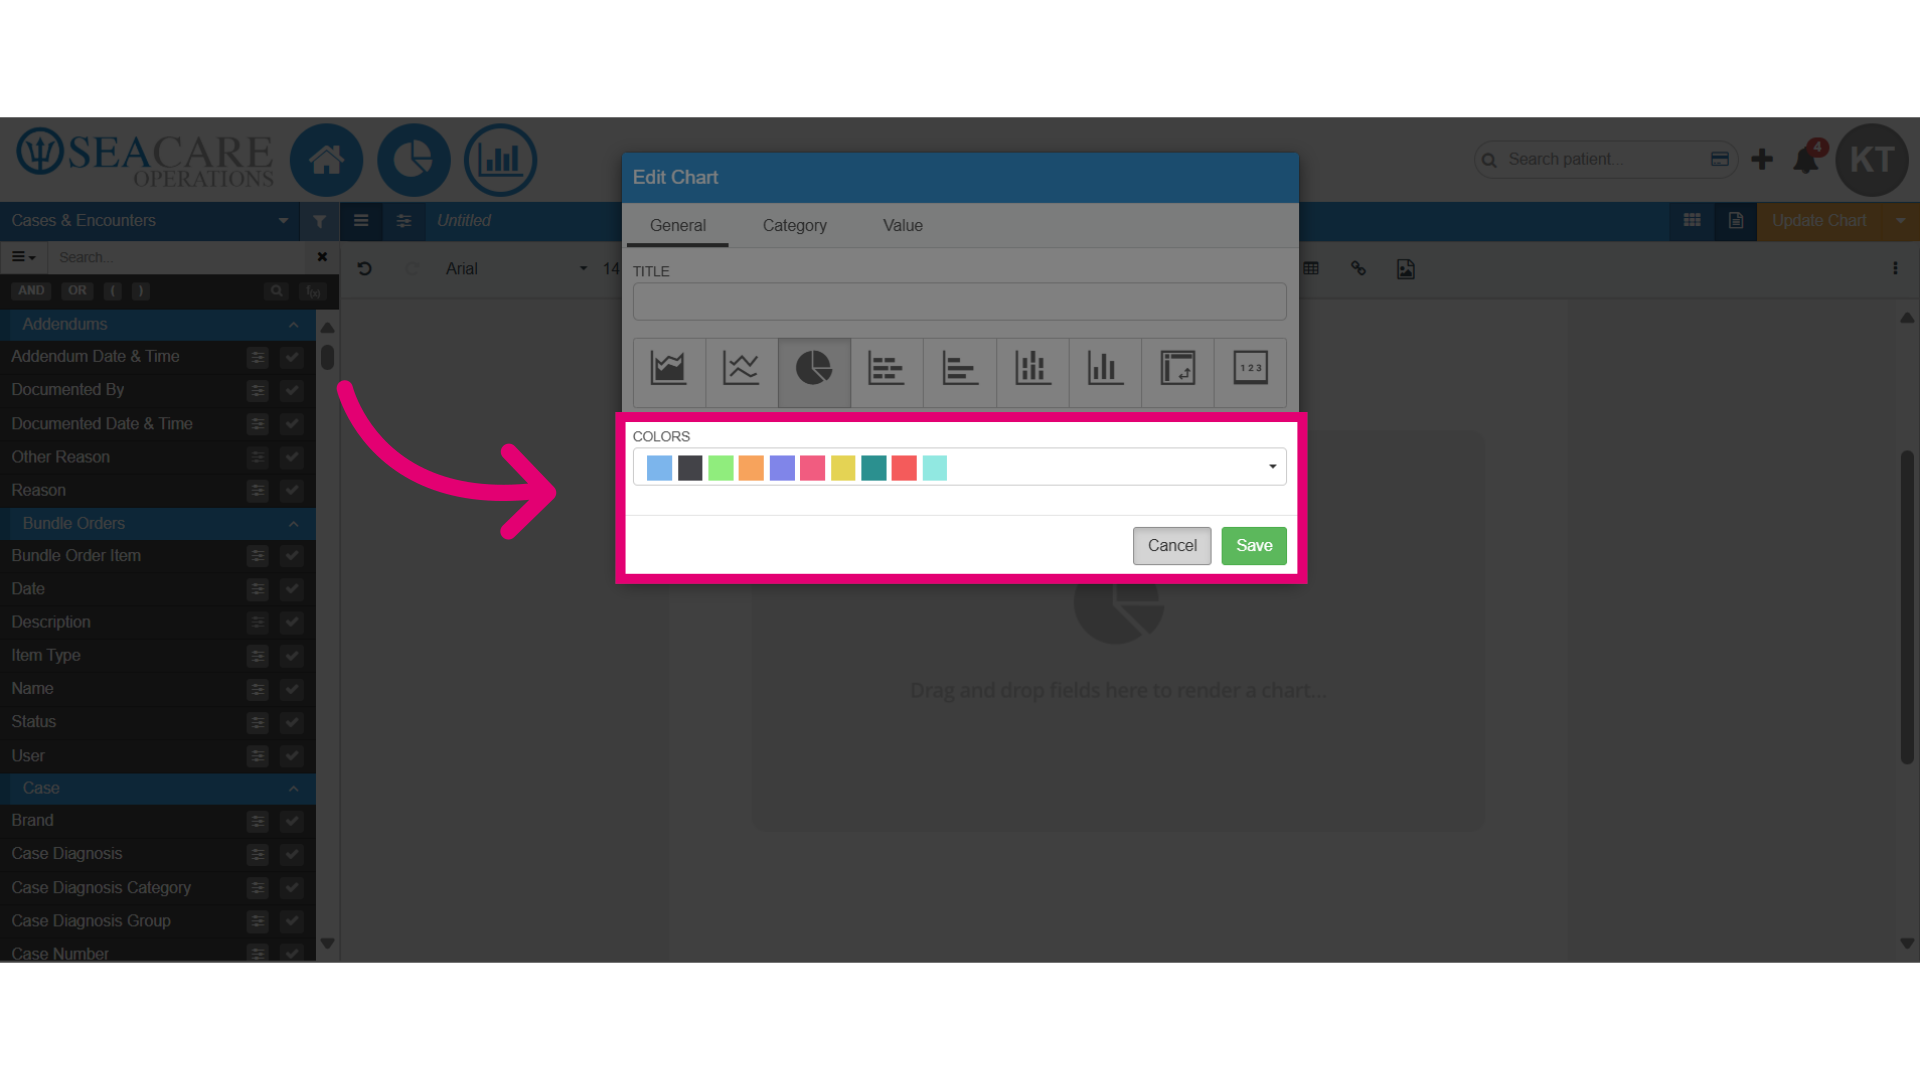
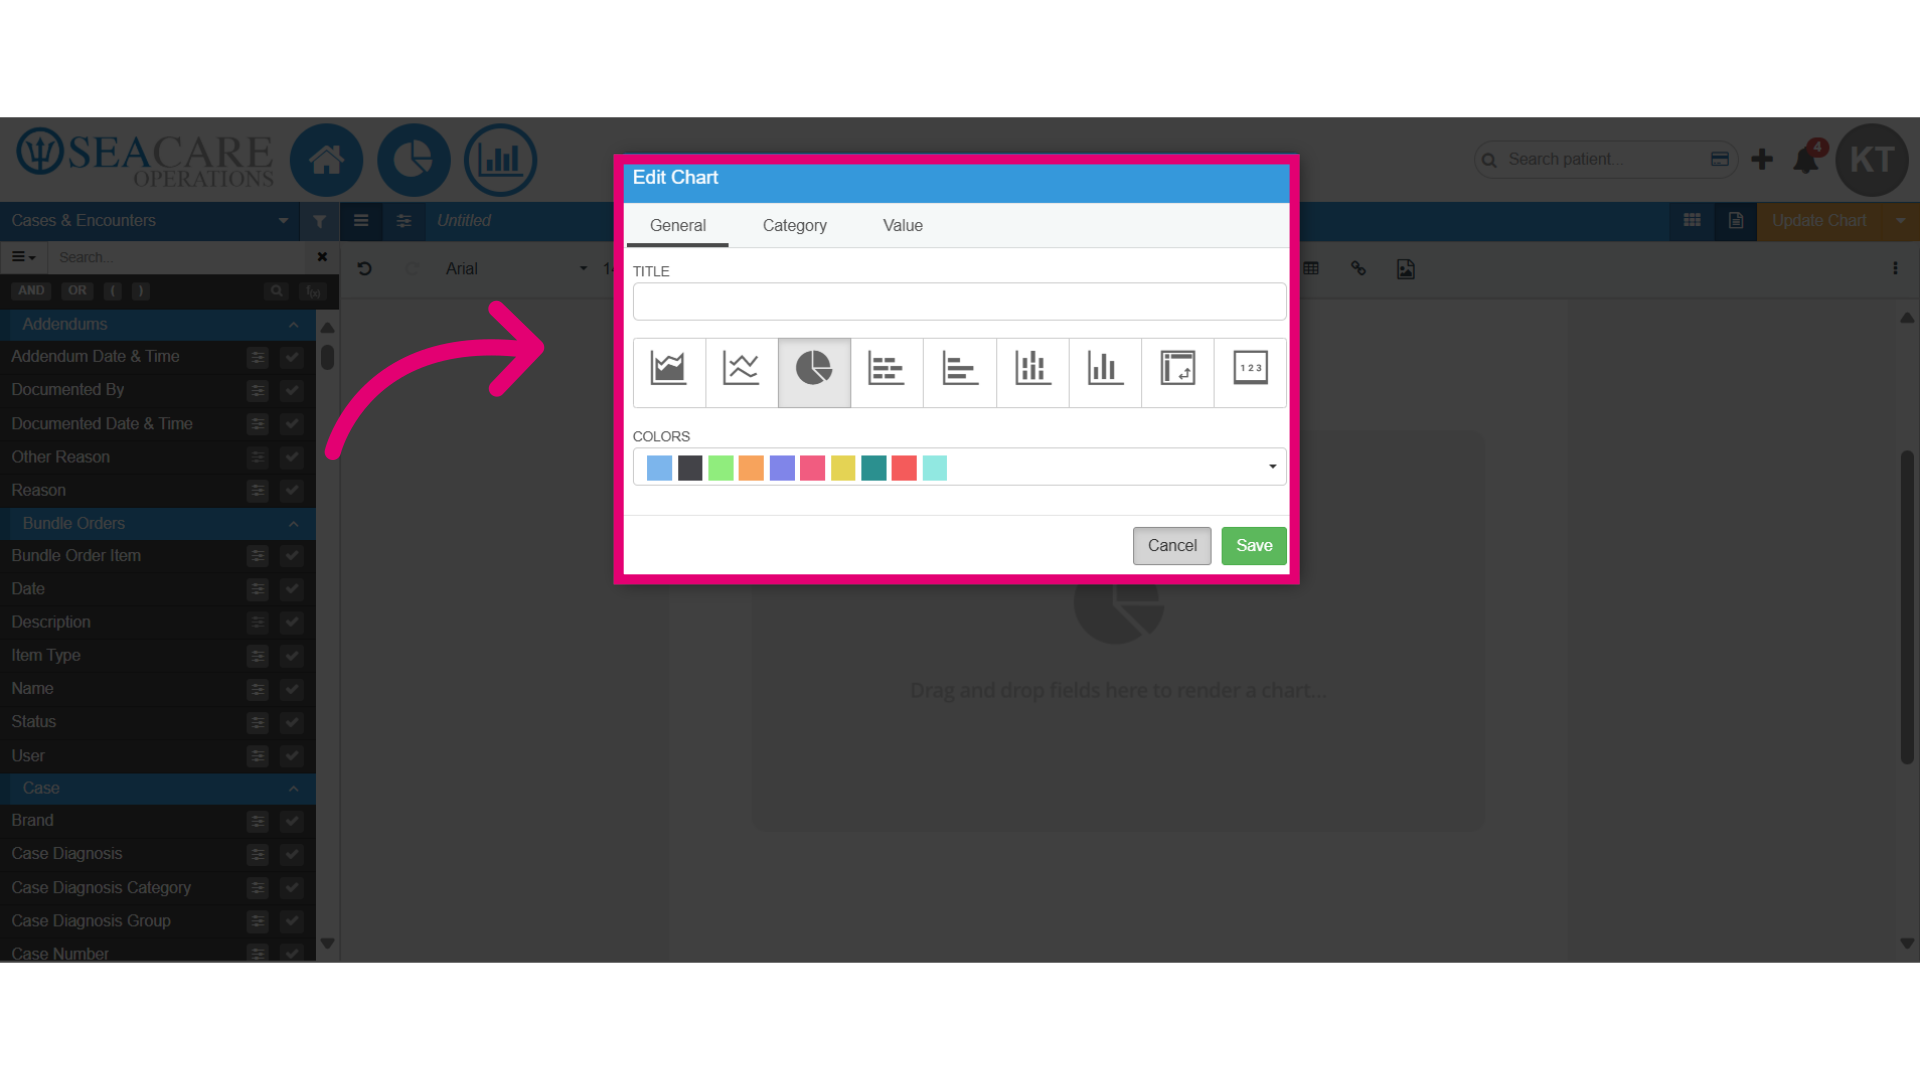
- Under the General tab, you can update the chart by:
- Adding a title
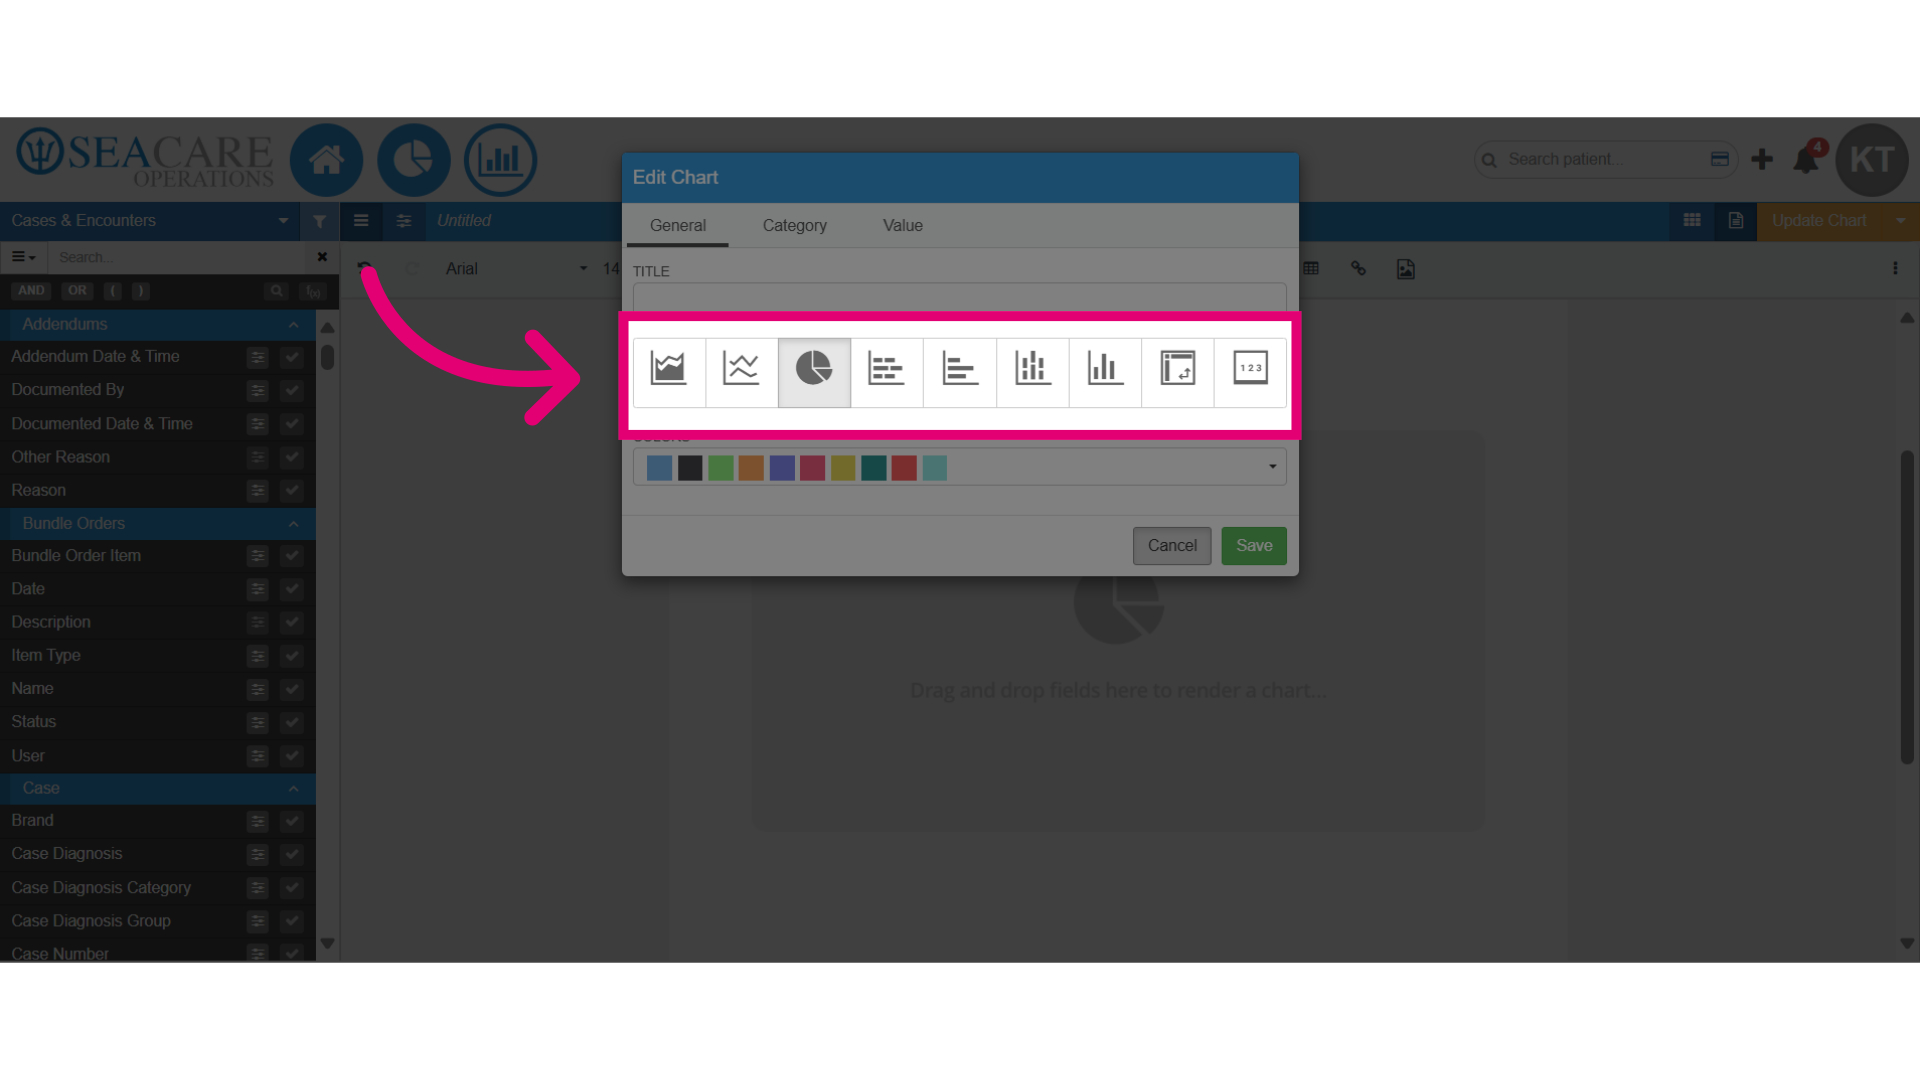
- Changing the chart type
- Select a different chart color
- Change the chart type as needed by hovering over each chart to see its type.
- To update the chart colour, select a colour from the available options and then click on Save to apply the modifications.